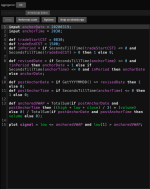
Anchored VWAP Indicator for ThinkorSwim

I have been enjoying the AVWAP tool based on longer time frames. I have found AVWAP being a great reference point when using the Covid Crash as the anchor. Many equities hit the Covid Lows AVWAP late 2022/early 2023 and bounced during this big rally.

However, I have been getting stuck on the coding for a scan.

Can some create a Scan for when Price crosses this AVWAP indicator (above or below) ?
Here is the tos link. https://tos.mx/3GZM8D9
Thank you in advance
Ruby:
input anchorDate = 20200319;
input anchorTime = 2030;

def tradeStartCST = 0830;
def tradeEndCST = 1500;
def inPeriod = if SecondsTillTime(tradeStartCST) <= 0 and SecondsTillTime(tradeEndCST) > 0 then 1 else 0;

def revisedDate = if SecondsTillTime(anchorTime)<=0 and !inPeriod then anchorDate+1 else if SecondsTillTime(anchorTime)<=0 and inPeriod then anchorDate else anchorDate;

def postAnchorDate = if GetYYYYMMDD() >= revisedDate then 1 else 0;
def postAnchorTime = if SecondsTillTime(anchorTime) <= 0 then 1 else 0;

plot anchoredVWAP = TotalSum(if postAnchorDate and postAnchorTime then ((high+low+close)/3)*(volume) else 0)/TotalSum(if postAnchorDate and postAnchorTime then volume else 0);

anchoredVWAP.setStyle(Curve.Firm);
anchoredVWAP.SetLineWeight(3);
anchoredVWAP.SetDefaultColor(Color.Cyan);

anchoredVWAP.setDefaultColor(getColor(0));
anchoredVWAP.AssignValueColor(if close>=VWAP then Color.Green else Color.Red);

#AddChartBubble(yes,close, revisedDate, color.yellow);
 
Last edited by a moderator:
I have figured a way to code it, but I had to use the thinkscript editor instead of the Conditions Wizard which doesnt allow me to input "within # bars"... so its only pulling stocks that are at AVWAP right this second, vs hit the past couple of days... does anyone know how to add the code "within # bars" when creating via thinkscript?
 

Attachments

  • Screenshot 2023-07-15 at 4.15.03 PM.png
    Screenshot 2023-07-15 at 4.15.03 PM.png
    115.1 KB · Views: 164
I have figured a way to code it, but I had to use the thinkscript editor instead of the Conditions Wizard which doesnt allow me to input "within # bars"... so its only pulling stocks that are at AVWAP right this second, vs hit the past couple of days... does anyone know how to add the code "within # bars" when creating via thinkscript?
change your "plot signal" to "def signal"
def signal = low <= anchoredVWAP and low[1] > anchoredVWAP;
and then add this:
plot scan = signal within 3 bars;

FYI, in future posts, instead of shared links and screen grabs, please cut & paste your code into your posts. Members will have an easier time answering you.
https://usethinkscript.com/threads/answers-to-commonly-asked-questions.6006/#post-58016
 
contribution share hoping it might be useful or can be made better.
I had been playing with current code wanting to make it more dynamic since the repaint of current HL code happens after the number of periods has occurred. The code below uses a different HL version making the vwap show at the point of possible HL. It still repaints, but it shows up sooner giving you a heads up of potential trend change. I further added a mid-line and mid line extension which seems what price better responds to as a confirmation point of the HL. Meaning, if price touches the mid point, the trend is likely to stick. if price breaks the mid-line (up or down), the H or L trend is further confirmed. I also added deviation lines for the mid line extension, which price does respond to.

I tried adding deviation lines to mid-line, but doesn't work as i had hoped. maybe someone can make it work.

Code:
#Anchored_VWAP_STOPS
#hint: VWAP stops anchored off FractalTrader pivots.

#hint n: Lookback period for finding swing highs, lows.
input n = 20;

#hint ticks: Offset VWAP lines by this number of ticks.
input ticks = 0.0;
def na = double.nan;
# define top and bottom of candle body
def top = high;#max(open, close);
def bot = low;#min(open, close);
def bn = BarNumber();
def lastBar = HighestAll(if IsNaN(close) then 0 else bn);
def offset = Min(n - 1, lastBar - bn);
def LL = bot < Lowest(bot[1], n - 1) and bot == GetValue(Lowest(bot, n), -offset);
 
def HH = top > Highest(top[1], n - 1) and top == GetValue(Highest(top, n), -offset);

def PivH = if HH > 0 then HH else Double.NaN;
def PivL = if LL > 0 then LL else Double.NaN;

rec dir = compoundValue(1, if !isNaN(PivL) then 1 else if !isNaN(PivH) then -1 else dir[1], 0);

plot Up =   dir crosses above 0;
Up.SetPaintingStrategy(PaintingStrategy.BOOLEAN_ARROW_UP);
Up.SetLineWeight(3);
Up.SetDefaultColor(Color.WHITE);

plot Dn =  dir crosses below 0;
Dn.SetPaintingStrategy(PaintingStrategy.BOOLEAN_ARROW_DOWN);
Dn.SetLineWeight(3);
Dn.SetDefaultColor(Color.ORANGE);

def LocH = (high + (TickSize() * ticks)) * volume;
def LocL = (low  - (TickSize() * ticks)) * volume;

rec PH;
rec VH;
rec PL;
rec VL;
rec PH2;
rec VH2;
rec PL2;
rec VL2;

if Dn {
PH = LocH;
VH = volume;
PH2 = PH[1];
VH2 = VH[1];
} else {
PH = compoundValue(1, LocH + PH[1], Double.NaN);
VH = compoundValue(1, volume + VH[1], Double.NaN);
PH2 = compoundValue(1, LocH + PH2[1], Double.NaN);
VH2 = compoundValue(1, volume + VH2[1], Double.NaN);
}
if Up  {
PL = LocL;
VL = volume;
PL2 = PL[1];
VL2 = VL[1];
} else {
PL = compoundValue(1, LocL + PL[1], Double.NaN);
VL = compoundValue(1, volume + VL[1], Double.NaN);
PL2 = compoundValue(1, LocL + PL2[1], Double.NaN);
VL2 = compoundValue(1, volume + VL2[1], Double.NaN);
}

plot VwapH = if Dn[-1] then Double.NaN else PH / VH;
plot VwapL = if Up[-1] then Double.NaN else PL / VL;
plot VwapH2 = if Dn[-1] then Double.NaN else PH2 / VH2;
plot VwapL2 = if Up[-1] then Double.NaN else PL2 / VL2;

input vwaprange = .05;
input showAVWAPcloud = yes;


VwapH.SetDefaultColor(Color.DARK_RED);
VwapL.SetDefaultColor(Color.DARK_GREEN);
plot vwapUpperRangeH = if showAVWAPcloud then VwapH + vwaprange else double.nan;
plot vwapUpperRangeL =  if showAVWAPcloud then VwapH - vwaprange  else double.nan;
plot vwapLowerRangeH =  if showAVWAPcloud then VwapL + vwaprange  else double.nan;
plot vwapLowerRangeL =  if showAVWAPcloud then VwapL - vwaprange  else double.nan;

input vwapMidlen = 55;
plot vwapMid = movingaverage(averageType.EXPONENTIAL,(vwaph + vwapl)/2, vwapMidlen);
plot vwapMidExt = movingaverage(averageType.EXPONENTIAL,(vwaph2 + vwapl2)/2, vwapMidlen);


input showmidcloud = yes;
input showmidcloudExt = yes;
plot VWAPMidH =  if showmidcloud then vwapMid + vwaprange else na;
plot VWAPMidL = if showmidcloud   then vwapMid - vwaprange else na;
plot VWAPMidH2 =  if showmidcloudExt then vwapMidext + vwaprange else na;
plot VWAPMidL2 = if showmidcloudExt   then vwapMidext - vwaprange else na;
def MidVwap = (VwapH - Vwapl) ;
def MidVwapExt = (VwapH2 - Vwapl2);

#### MEDian DEV BANDS -- NOT WORKING AS EXPECTED. turned off for now.
#def volmid = (vh+vl)/2;
#def    volumevwap2sum =   CompoundValue(1, volumevwap2sum[1] + volmid * Sqr(MidVwap), volmid * Sqr(MidVwap));
 
#def    deviation  = Sqrt(Max(volumevwap2sum / volmid - Sqr(MidVwap), 0));
#plot mid_Div1H = vwapMid  + (deviation * 1.5);
#plot mid_DivH2 = vwapMid + (MidVwap * 2);
#plot mid_DivH3 = vwapMid + (MidVwap * 3);
#plot mid_Div1L = vwapMid - (deviation * 1.5);
#plot mid_DivL2 = vwapMid - (MidVwap * 2);
#plot mid_DivL3 = vwapMid - (MidVwap * 3);
#### MEDian EXT DEV BANDS
plot midExt_Div1H = vwapMidExt + (MidVwapExt * 1);
plot midExt_DivH3 = vwapMidExt + (MidVwapExt * 2.5);
plot midExt_DivH2 = vwapMidExt + (MidVwapExt * 2);
plot midExt_Div1L = vwapMidExt - (MidVwapExt * 1);
plot midExt_DivL2 = vwapMidExt - (MidVwapExt * 2);
plot midExt_DivL3 = vwapMidExt - (MidVwapExt * 2.5);

#END STUDY

DefineGlobalColor("Bullish", color.green);
DefineGlobalColor("Bearish", Color.PLUM);
DefineGlobalColor("Midline", color.yellow);
DefineGlobalColor("MidlineExt", color.Gray);
AddCloud(if showAVWAPcloud then vwapUpperRangeH else Double.NaN, vwapUpperRangeL, GlobalColor("Bearish"), GlobalColor("Bearish"));
AddCloud(if showAVWAPcloud then vwapLowerRangeH else Double.NaN, vwapLowerRangeL, GlobalColor("Bullish"), GlobalColor("Bullish"));
AddCloud(if showmidcloud then VWAPMidH else Double.NaN, VWAPMidL, GlobalColor("Midline"), GlobalColor("Midline"));
AddCloud(if showmidcloudExt then VWAPMidH2 else Double.NaN, VWAPMidL2, GlobalColor("Midline"), GlobalColor("Midline"));
Input showMidevCloud = yes;

AddCloud(if showMidevCloud then midExt_DivH2 else Double.NaN, midExt_DivH3, GlobalColor("MidlineExt"), GlobalColor("MidlineExt"));
AddCloud(if showMidevCloud then midExt_DivL2 else Double.NaN, midExt_DivL3, GlobalColor("MidlineExt"), GlobalColor("MidlineExt"));
 
I've tried all the version of above Anchored Vwap. Its not working on 1D:5min or 10 min and even for lower timeframe. I see the signals are after 30 mins of the move. Is this proper indicator posted here?
 
Yes, after modifying the script by renaming all of the plots as defs and defining a plot scan. As you did not indicate what you wanted in a scan, see an example in code below for one of many that can be done.
how to I add OHLC4 to the vwap swings?
 
Can any of these scripts be anchored to a particular date and time, and plotted on subsequent days?

The first script in @BenTen's OP doesn't seem to do this for intraday times. For example, I'd like to anchor to FOMC statement release at 2pm EST 2023-12-13. That first script allows you to anchor there, but it only updates starting at 2pm EST. It ignores all the volume and prices from 9:30am-2pm.
 
how to I add OHLC4 to the vwap swings?

I think this is what you are requesting, so I added option to use High or Ohlc4 for PivotHigh_Basis.

Screenshot 2023-12-18 152657.png
Code:
#START STUDY
#Anchored_VWAPv3
#linus, 2014-03-10, v0.1

#10:24 linus: it carries over the previous pivot's lines for high, low and close. (it plots vwaps of the high, low and close that are reset each time a new pivot is found.)
#10:25 linus: i wrote it to experiment with vwap as stops. (the high and low vwaps that can be offset by the ticks input.)
#10:25 linus: but it should serve as an example of how to reset the vwaps based on a signal.
#10:35 linus: #hint: VWAP stops anchored off  fractalTrader pivots.
#10:37 linus: the code calculates the pivots as PivH and PivL, and then restarts the high, low and close vwaps when it finds a new pivot.  Otherwise it continues to calculate the high, low and close vwaps.
#10:37 linus: the dashed vwap plots are the saved from the previous pivot, and the solid vwap plots are since the last pivot.
#20220708 Sleepyz used missing logic from Mobius fractal pivots
#20230315 Sleepyz modified the VwapH and VwapL off the high/low respective of PivotH/PivotL
#20230317 Sleepyz added optional bubbles vs arrows at VwapH/VwapL
#20231218 Sleepyz added option to use High or Ohlc4 for PivotHigh_Basis

#hint: VWAP stops anchored off  fractalTrader pivots.

#hint n: Lookback period for finding swing highs, lows.
input n = 20;
input showarrows  = yes;
input showbubbles = yes;

#hint ticks: Offset High/Low VWAP lines by this number of ticks.
input ticks  = 0.0;
def bn       = BarNumber();
def na       = Double.NaN;
def bnOK     = bn > n;

#Use High or OHLC4 for Pivot High
input PivotHigh_Basis = {default High, OHLC4};
def h = if PivotHigh_Basis==PivotHigh_Basis.OHLC4 then Ohlc4 else High;

def isHigher = fold i = 1 to n + 1 with p = 1
               while p do h > GetValue(h, -i);

def HH       = if bnOK and isHigher and
                  h == Highest(h, n)
               then h else na;

def isLower  = fold j = 1 to n + 1 with q = 1
               while q do low < GetValue(low, -j);

def LL       = if bnOK and isLower and
                  low == Lowest(low, n)
               then low else na;

def PHBar    = if !IsNaN(HH)
               then bn
               else PHBar[1];

def PLBar    = if !IsNaN(LL)
               then bn
               else PLBar[1];

def PHL     = if !IsNaN(HH)
              then HH
              else PHL[1];

def PLL     = if !IsNaN(LL)
              then LL
              else PLL[1];

def priorPHBar = if PHL != PHL[1]
                 then PHBar[1]
                 else priorPHBar[1];

def priorPLBar = if PLL != PLL[1]
                 then PLBar[1]
                 else priorPLBar[1];

def HighPivots = bn >= HighestAll(priorPHBar);
def LowPivots  = bn >= HighestAll(priorPLBar);

def PivH       = if !IsNaN(HH) > 0 then HighPivots else na;
def PivL       = if !IsNaN(LL) > 0 then LowPivots  else na;

plot Up        = bn == PLBar;
Up.SetPaintingStrategy(PaintingStrategy.BOOLEAN_ARROW_UP);
Up.SetLineWeight(3);
Up.SetDefaultColor(Color.WHITE);
Up.SetHiding(!showarrows);
AddChartBubble(showbubbles and bn == PLBar, low, AsText(low), Color.GREEN, no);

plot Dn        = bn == PHBar;
Dn.SetPaintingStrategy(PaintingStrategy.BOOLEAN_ARROW_DOWN);
Dn.SetLineWeight(3);
Dn.SetDefaultColor(Color.ORANGE);
Dn.SetHiding(!showarrows);
AddChartBubble(showbubbles and bn == PHBar, h, AsText(h), Color.RED);

def LocH = (h + (TickSize() * ticks)) * volume;
def LocL = (low  - (TickSize() * ticks)) * volume;
def LocC = close * volume;

rec PC;
rec VC;
rec PC2;
rec VC2;
rec PH;
rec VH;
rec PL;
rec VL;
rec PH2;
rec VH2;
rec PL2;
rec VL2;

if Dn or Up {
    PC = LocC;
    VC = volume;
    PC2 = PC[1];
    VC2 = VC[1];
} else {
    PC = CompoundValue(1, LocC + PC[1], na);
    VC = CompoundValue(1, volume + VC[1], na);
    PC2 = CompoundValue(1, LocC + PC2[1], na);
    VC2 = CompoundValue(1, volume + VC2[1], na);
}

if Dn {
    PH = LocH;
    VH = volume;
    PH2 = PH[1];
    VH2 = VH[1];
} else {
    PH = CompoundValue(1, LocH + PH[1], na);
    VH = CompoundValue(1, volume + VH[1], na);
    PH2 = CompoundValue(1, LocH + PH2[1], na);
    VH2 = CompoundValue(1, volume + VH2[1], na);
}
if Up  {
    PL = LocL;
    VL = volume;
    PL2 = PL[1];
    VL2 = VL[1];
} else {
    PL = CompoundValue(1, LocL + PL[1], na);
    VL = CompoundValue(1, volume + VL[1], na);
    PL2 = CompoundValue(1, LocL + PL2[1], na);
    VL2 = CompoundValue(1, volume + VL2[1], na);
}

plot VwapC = if Dn[-1] or Up[-1] then na else PC / VC;
plot VwapC2 = if Dn[-1] or Up[-1] then na else PC2 / VC2;
plot VwapH = if Dn[-1] then na else PH / VH;
plot VwapL = if Up[-1] then na else PL / VL;
plot VwapH2 = if Dn[-1] then na else PH2 / VH2;
plot VwapL2 = if Up[-1] then na else PL2 / VL2;

VwapC.SetDefaultColor(Color.YELLOW);
VwapC.SetLineWeight(2);
VwapC.HideBubble();

VwapC2.SetDefaultColor(Color.YELLOW);
VwapC2.SetLineWeight(2);
VwapC2.SetStyle(Curve.SHORT_DASH);
VwapC2.HideBubble();

VwapH.SetDefaultColor(Color.DARK_RED);
VwapH.HideBubble();
VwapH.SetLineWeight(5);

VwapL.SetDefaultColor(Color.DARK_GREEN);
VwapL.HideBubble();
VwapL.SetLineWeight(5);

VwapH2.SetDefaultColor(Color.DARK_RED);
VwapH2.SetStyle(Curve.SHORT_DASH);
VwapH2.HideBubble();

VwapL2.SetDefaultColor(Color.DARK_GREEN);
VwapL2.SetStyle(Curve.SHORT_DASH);
VwapL2.HideBubble();
#END STUDY
;
 
I am trying to compare this study to the built-in VWAP in TOS and can't get agreement with the same starting bar.

I have tried various combinations of closing, (closing+open)/2 etc even LOW and find it is higher than TOS vwap.

I numerically checked it and the results are correct. I am using a daily chart and wondering if the TOS indicator is using intraday data rather than end of day for the calculation of vwap on a daily
can some one please help? i have same issue, the anchored vwap stop code above is a little off, it's a little off compared with build-in Vwap from TOS ( set to same point)
 
I think this is what you are requesting, so I added option to use High or Ohlc4 for PivotHigh_Basis.
Thanks so much I really appreciate it! Is there any way to add OHLC4 to the swing low as well? Sorry to be a pain in the A$$, I tried to script but it did no work. Thanks again for all your help!
 
Hi, these scripts are great, however I wanted to make a slight adjustment to dynamically anchor it to the the beginning of the week or the day prior. However I get differet results. Here is my code example

Code:
Why does these two code base give different results:  Code Base-1: [# Get the current date in YYYYMMDD format
def today = GetYYYYMMDD();

# Calculate the day before yesterday (adjusting for weekends)
def priorDay = if GetDayofWeek(today) == 1
  # If today is Monday, subtract 3 days (for Saturday and Sunday)
  then today - 3
  else today - 1;

def anchorDate = priorDay;
# Add labels for reference (optional)
addlabel(1, "days back " + priorDay, color.yellow);
addlabel(1, anchorDate, color.yellow);

# Define anchor date and time

def anchorTime = 0930;

# Define trading period
def tradeStartEST = 0930;
def tradeEndEST = 1600;
def inPeriod = if SecondsTillTime(tradeStartEST) <= 0 and SecondsTillTime(tradeEndEST) > 0 then 1 else 0;

#def revisedDate = if SecondsTillTime(anchorTime)<=0 and !inPeriod then anchorDate+1 else if SecondsTillTime(anchorTime)<=0 and inPeriod then anchorDate else anchorDate;

def postAnchorDate = if GetYYYYMMDD() >= anchorDate then 1 else 0;
def postAnchorTime = if SecondsTillTime(anchorTime) <= 0 then 1 else 0;

plot anchoredVWAP = TotalSum(if postAnchorDate and postAnchorTime then ((high+low+close)/3)*(volume) else 0)/TotalSum(if postAnchorDate and postAnchorTime then volume else 0);

anchoredVWAP.setStyle(Curve.Firm);
anchoredVWAP.SetLineWeight(2);
anchoredVWAP.SetDefaultColor(Color.white);

#AddChartBubble(yes,close, revisedDate, color.yellow);]
 Code Base-2: [# Get the current date in YYYYMMDD format
def today = GetYYYYMMDD();

# Calculate the day before yesterday (adjusting for weekends)
def priorDay = if GetDayofWeek(today) == 1
    # If today is Monday, subtract 3 days (for Saturday and Sunday)
    then today - 3
    else today - 1;

def anchorDate = 20240201;
# Add labels for reference (optional)
addlabel(1, "days back " + priorDay, color.yellow);
addlabel(1, anchorDate, color.yellow);

# Define anchor date and time

def anchorTime = 0930;

# Define trading period
def tradeStartEST = 0930;
def tradeEndEST = 1600;
def inPeriod = if SecondsTillTime(tradeStartEST) <= 0 and SecondsTillTime(tradeEndEST) > 0 then 1 else 0;

#def revisedDate = if SecondsTillTime(anchorTime)<=0 and !inPeriod then anchorDate+1 else if SecondsTillTime(anchorTime)<=0 and inPeriod then anchorDate else anchorDate;

def postAnchorDate = if GetYYYYMMDD() >= anchorDate then 1 else 0;
def postAnchorTime = if SecondsTillTime(anchorTime) <= 0 then 1 else 0;

plot anchoredVWAP = TotalSum(if postAnchorDate and postAnchorTime then ((high+low+close)/3)*(volume) else 0)/TotalSum(if postAnchorDate and postAnchorTime then volume else 0);

anchoredVWAP.setStyle(Curve.Firm);
anchoredVWAP.SetLineWeight(2);
anchoredVWAP.SetDefaultColor(Color.white);

#AddChartBubble(yes,close, revisedDate, color.yellow);
]
 
How would I be able to scan for the up and down arrows on the Anchored VWAP 2.0?

Also, does this indicator repaint or would a candle need to close based on testing it?
 
How would I be able to scan for the up and down arrows on the Anchored VWAP 2.0?

As you didn't provide a script, it is not possible to give an exact solution.
The "general" answer is:

The scan filter would be:
whateverArrow is true
replace the name whateverArrow with the name of the arrow in the script.

For more assistance is creating scan:
https://usethinkscript.com/threads/how-to-use-thinkorswim-stock-hacker-scans.284/


Also, does this indicator repaint or would a candle need to close based on testing it?
Neither the VWAP nor any other moving average indicators on the forum "repaint"
The repainting indicators have a "repaints" prefix.
HOWEVER
Almost all the indicators on the forum update every tick until the candle is closed.
 

Join useThinkScript to post your question to a community of 21,000+ developers and traders.

Similar threads

Not the exact question you're looking for?

Start a new thread and receive assistance from our community.

87k+ Posts
432 Online
Create Post

Similar threads

Similar threads

The Market Trading Game Changer

Join 2,500+ subscribers inside the useThinkScript VIP Membership Club
  • Exclusive indicators
  • Proven strategies & setups
  • Private Discord community
  • ‘Buy The Dip’ signal alerts
  • Exclusive members-only content
  • Add-ons and resources
  • 1 full year of unlimited support

Frequently Asked Questions

What is useThinkScript?

useThinkScript is the #1 community of stock market investors using indicators and other tools to power their trading strategies. Traders of all skill levels use our forums to learn about scripting and indicators, help each other, and discover new ways to gain an edge in the markets.

How do I get started?

We get it. Our forum can be intimidating, if not overwhelming. With thousands of topics, tens of thousands of posts, our community has created an incredibly deep knowledge base for stock traders. No one can ever exhaust every resource provided on our site.

If you are new, or just looking for guidance, here are some helpful links to get you started.

What are the benefits of VIP Membership?
VIP members get exclusive access to these proven and tested premium indicators: Buy the Dip, Advanced Market Moves 2.0, Take Profit, and Volatility Trading Range. In addition, VIP members get access to over 50 VIP-only custom indicators, add-ons, and strategies, private VIP-only forums, private Discord channel to discuss trades and strategies in real-time, customer support, trade alerts, and much more. Learn all about VIP membership here.
How can I access the premium indicators?
To access the premium indicators, which are plug and play ready, sign up for VIP membership here.
Back
Top