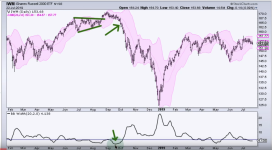
#HINT: educational example of how to create code using ThinkScript. This code creates a chart label denoting when all 3 conditions are met.


# this line tells ThinkScript where you want the study to appear on the chart -- your choices are declare upper; or declare lower;


declare upper;


# input fields allow you to quickly edit your custom strategy without need to alter the ThinkScript code.


input BB_period = 20;

input ADX_period = 14;

input SMA_period = 9;


# def fields allow you to teach ThinkScript new 'words' to make using your new 'words' later in the code easier and faster


def x = BollingerBands(BB_period).UpperBand;

def y = adx(ADX_period);

def z = simpleMovingAvg("length" = SMA_period);


def condition = close > x AND y > 25 and z > z[1];


# this line of code is longer than typical chart label and includes the word Concat (telling ThinkScript I'm about to give you several conditions strung together).  This allows the label to appear with different words and different colors depending on whether condition is true or false (true == 1 and false == 0)


# with a label, words between "___" will appear in the label. To create a blank label leave blank space or spaces between the " "


AddLabel(yes, Concat( "", Concat(" ",

if condition == 1 then "All 3 conditions are TRUE: BB, ADX, SMA " else

if condition == 0 then "WAIT until BB, ADX and SMA are all true " else " WAIT ")),

if condition == 1 then Color.GREEN else

if condition == 0 then Color.PLUM else

Color.PLUM);

