

AGAIG TREND OVERALL SIMPLIFIED
Chart Look:
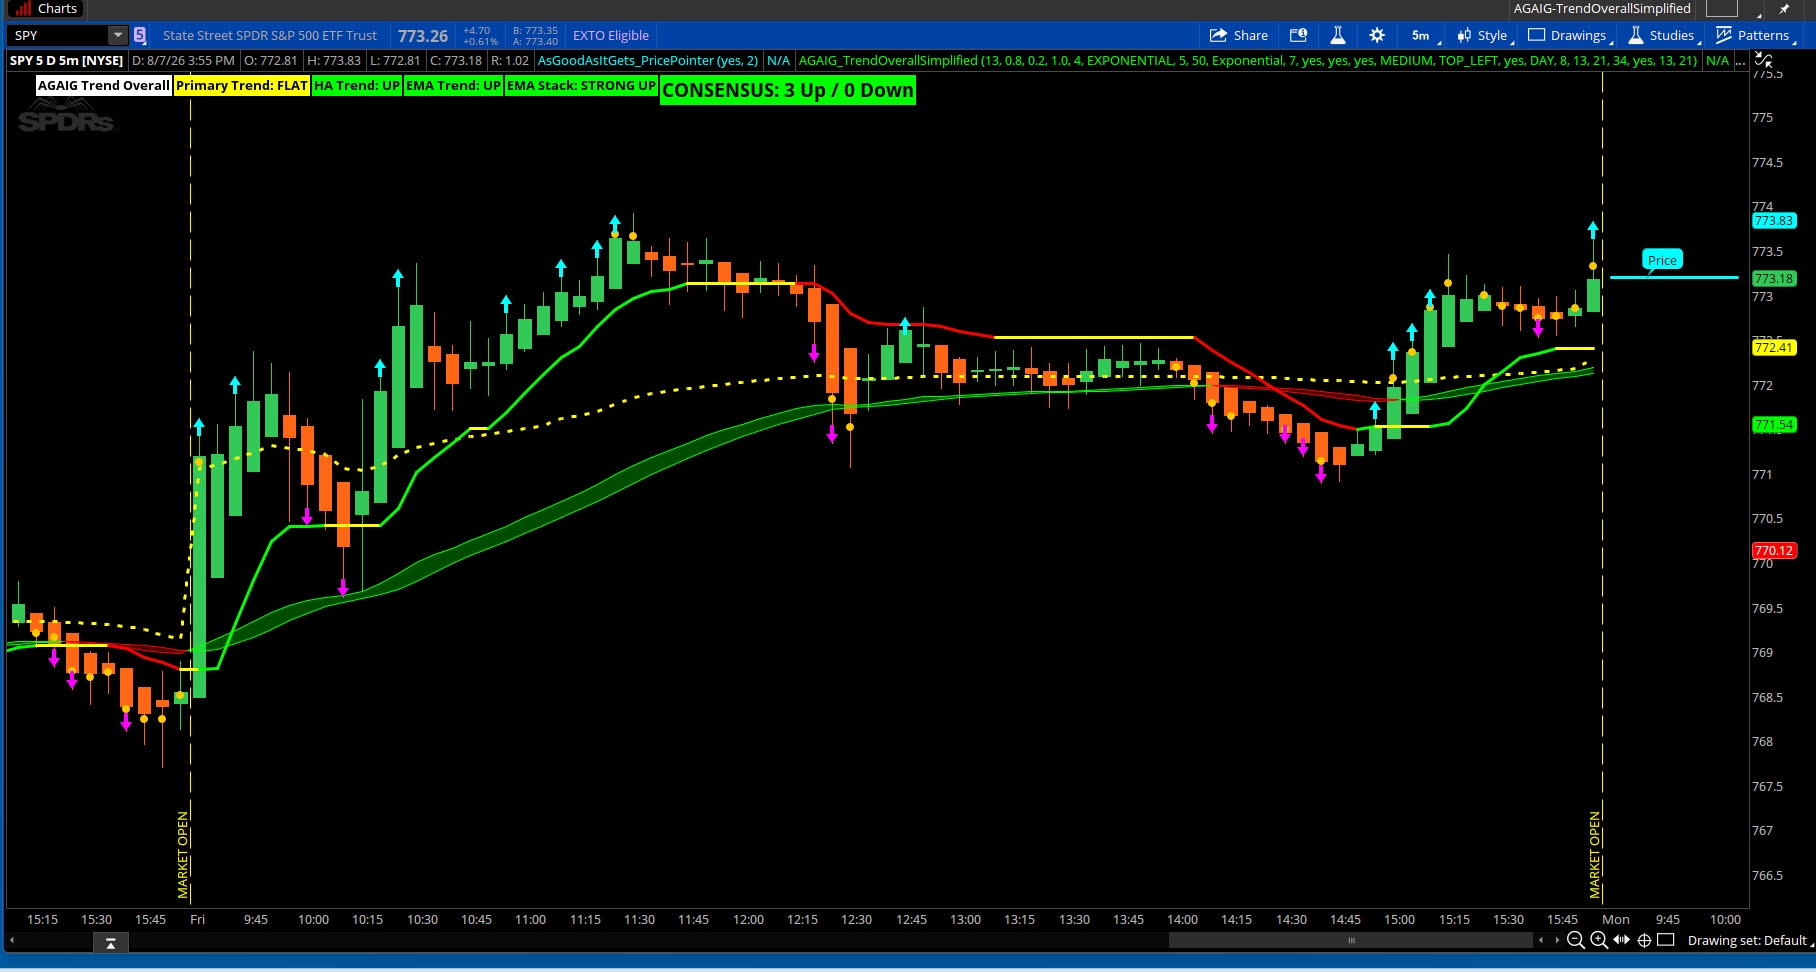
My goal is to continually simplify the decision process. In this indicator I am taking several parameters using consensus labels and minimal chart labels for decision making.
A few quick notes for how to actually use it day to day:
- The DMI adaptive line (green/red) is your primary bias. Trade with its color, not against it — it's built to hug price closely in trends and flatten out in chop, so when it turns yellow, that's your cue to expect range-bound action, not a clean trend.
- HA cloud = zone, not signal. Think of it as "which side of the fence are we on" context, not a trigger. Use it to filter — only take Buy arrows when the cloud is green, only take Sell arrows when it's red.
- Volume dots mean the most when they line up with a STRONG EMA Stack read. A lone dot is just "volume was elevated." A dot next to STRONG UP/DOWN is real participation confirming an already-aligned trend — that's the higher-conviction setup.
- Consensus label is a tiebreaker, not a trigger. It's most useful for staying out of the market — if it's sitting at 2-3 or 3-2, that's a "sit on hands" reading. 4-1 or 5-0 is when the whole stack agrees.
- The Buy/Sell arrows are the most reactive part of the indicator (Super Trend cross + fractal RSI momentum), so they'll fire early and sometimes get faked out in chop — that's exactly why the Consensus and DMI line exist, to give you something slower to check them against before acting.
- On 5-min charts, don't force it to react instantly — the HA cloud and EMA Stack are the "slow" reads here (4hr+ effective smoothing), so let them set direction and use the faster elements for timing entries within that direction, not for calling the trend itself.
In addition to this indicator I use a couple of other indicators on my chart for decision making. Coming soon a separate chart set-up for you to review.
Feedback is always appreciated.
Indicator Link: http://tos.mx/!Nb0Y7Cie
Code:
#AGAIG Trend Overall Simplified
#Consolidates: Fractal Energy RSI + SuperTrend, DMI adaptive trend, Heikin-Ashi
#cloud, EMA slope trend, and breakout arrows into one study.
#Only one trend line is plotted on chart: the DMI adaptive trend (speeds up
#in trends, slows down in chop). The other trend reads (EMA slope, HA state,
#Primary/SuperTrend) are shown as color-coded labels instead of extra lines.
declare upper;

#================= INPUTS =================
input nFE = 13;                          #hint nFE: length for Fractal Energy RSI
input overbought = 0.80;
input oversold = 0.20;
input atrMult = 1.0;
input nATR = 4;
input atrAvgType = AverageType.EXPONENTIAL;
input dmiPeriod = 5;
input haPeriod = 50;
input haAvgType = {default Exponential, SIMPLE};
input emaLength = 7;
input showLabels = yes;
input showCloud = yes;
input showSignalArrows = yes;
input LabelSize     = fontsize.medium;
input LabelLocation = location.top_left;

#================= 1. FRACTAL ENERGY RSI + SUPERTREND =================
def o1 = (open + close[1]) / 2;
def h1 = Max(high, close[1]);
def l1 = Min(low, close[1]);
def c1 = (o1 + h1 + l1 + close) / 4;

def gamma = Log(Sum(Max(high, close[1]) - Min(low, close[1]), nFE) /
            (Highest(high, nFE) - Lowest(low, nFE))) / Log(nFE);

def FL0 = (1 - gamma) * c1 + gamma * FL0[1];
def FL1 = -gamma * FL0 + FL0[1] + gamma * FL1[1];
def FL2 = -gamma * FL1 + FL1[1] + gamma * FL2[1];
def FL3 = -gamma * FL2 + FL2[1] + gamma * FL3[1];

def CU1 = if FL0 >= FL1 then FL0 - FL1 else 0;
def CD1 = if FL0 >= FL1 then 0 else FL1 - FL0;
def CU2 = if FL1 >= FL2 then CU1 + FL1 - FL2 else CU1;
def CD2 = if FL1 >= FL2 then CD1 else CD1 + FL2 - FL1;
def CU  = if FL2 >= FL3 then CU2 + FL2 - FL3 else CU2;
def CD  = if FL2 >= FL3 then CD2 else CD2 + FL3 - FL2;

def fractalRSI = if CU + CD <> 0 then CU / (CU + CD) else 0;

def ATR = MovingAverage(atrAvgType, TrueRange(high, close, low), nATR);
def UP = HL2 + atrMult * ATR;
def DN = HL2 - atrMult * ATR;
def ST = if close < ST[1] then UP else DN;

def upVotes = Sum(fractalRSI > overbought, 20);
def dnVotes = Sum(fractalRSI < oversold, 20);

plot Buy = if showSignalArrows and upVotes > dnVotes and close > ST and close[1] < ST[1] then low else Double.NaN;
Buy.SetPaintingStrategy(PaintingStrategy.ARROW_UP);
Buy.SetDefaultColor(Color.GREEN);
Buy.SetLineWeight(2);

plot Sell = if showSignalArrows and upVotes < dnVotes and close < ST and close[1] > ST[1] then high else Double.NaN;
Sell.SetPaintingStrategy(PaintingStrategy.ARROW_DOWN);
Sell.SetDefaultColor(Color.RED);
Sell.SetLineWeight(2);

#================= 2. DMI-BASED ADAPTIVE TREND LINE =================
#This is the one plotted trend line on the chart - it speeds up in strong
#trends and slows down in chop, so it tracks price better than a fixed-length
#moving average while still being read as "the" trend line.
def dmiWeight = dmiPeriod;

def pdm = if close > close[1]
          then (((dmiWeight - 1) * pdm[1]) + close - close[1]) / dmiWeight
          else (((dmiWeight - 1) * pdm[1]) + 0) / dmiWeight;
def mdm = if close > close[1]
          then (((dmiWeight - 1) * mdm[1]) + 0) / dmiWeight
          else (((dmiWeight - 1) * mdm[1]) + close[1] - close) / dmiWeight;

def dmSum = pdm + mdm;
def pdi = if dmSum > 0 then (((dmiWeight - 1) * pdi[1]) + pdm / dmSum) / dmiWeight
          else (((dmiWeight - 1) * pdi[1]) + 0) / dmiWeight;
def mdi = if dmSum > 0 then (((dmiWeight - 1) * mdi[1]) + mdm / dmSum) / dmiWeight
          else (((dmiWeight - 1) * mdi[1]) + 0) / dmiWeight;

def diDiff = AbsValue(pdi - mdi);
def diSum = Round(pdi + mdi, 0);
def dx = if diSum > 0 then (((dmiWeight - 1) * dx[1]) + diDiff / diSum) / dmiWeight
         else (((dmiWeight - 1) * dx[1]) + 0) / dmiWeight;

#Original script rebuilt a rolling max/min of dx by hand with fold loops -
#that's exactly what Highest()/Lowest() already do.
def dxHigh = Highest(dx, dmiPeriod);
def dxLow = Lowest(dx, dmiPeriod);
def dxRange = dxHigh - dxLow;
def chande = if dxRange > 0 then (dx - dxLow) / dxRange else 0;

def dmiTrend = CompoundValue(1, (((dmiPeriod - chande) * dmiTrend[1]) + (chande * close)) / dmiPeriod, close);
def dmiSlope = (dmiTrend - dmiTrend[1]) / TickSize();

plot AdaptiveTrend = dmiTrend;
AdaptiveTrend.SetLineWeight(3);
AdaptiveTrend.DefineColor("Up", Color.GREEN);
AdaptiveTrend.DefineColor("Down", Color.RED);
AdaptiveTrend.DefineColor("Flat", Color.YELLOW);
AdaptiveTrend.AssignValueColor(
    if dmiSlope > 0.1 then AdaptiveTrend.Color("Up")
    else if dmiSlope < -0.1 then AdaptiveTrend.Color("Down")
    else AdaptiveTrend.Color("Flat"));

#================= 3. HEIKIN-ASHI TREND CLOUD =================
def openMA;
def closeMA;
def highMA;
def lowMA;
switch (haAvgType) {
case SIMPLE:
    openMA = Average(open, haPeriod);
    closeMA = Average(close, haPeriod);
    highMA = Average(high, haPeriod);
    lowMA = Average(low, haPeriod);
case Exponential:
    openMA = ExpAverage(open, haPeriod);
    closeMA = ExpAverage(close, haPeriod);
    highMA = ExpAverage(high, haPeriod);
    lowMA = ExpAverage(low, haPeriod);
}

def haOpen = CompoundValue(1, (haOpen[1] + (openMA[1] + highMA[1] + lowMA[1] + closeMA[1]) / 4) / 2, open);
def haClose = (openMA + highMA + lowMA + closeMA) / 4;
def haTrendUp = haClose > haOpen;

plot CloudTop = if showCloud then haClose else Double.NaN;
plot CloudBot = if showCloud then haOpen else Double.NaN;
CloudTop.Hide();
CloudBot.Hide();
AddCloud(CloudBot, CloudTop, Color.RED, Color.GREEN, yes);

#================= 4. EMA SLOPE TREND (label only, no plotted line) =================
def emaTrend = ExpAverage(ExpAverage(close, emaLength), emaLength);
def emaSlope = (emaTrend - emaTrend[1]) / TickSize();

#================= 5. BREAKOUT ARROWS =================
def highestClose4 = Highest(close[1], 4);
def lowestClose4 = Lowest(close[1], 4);
def lowestLow4 = Lowest(low[1], 4);
def highestHigh4 = Highest(high[1], 4);
def tightRange = highestClose4 / lowestClose4 < 1.01;

plot BearBreak = if showSignalArrows and tightRange and close < lowestLow4 and high > low then low else Double.NaN;
BearBreak.SetPaintingStrategy(PaintingStrategy.ARROW_DOWN);
BearBreak.SetDefaultColor(Color.MAGENTA);
BearBreak.SetLineWeight(3);

plot BullBreak = if showSignalArrows and tightRange and close > highestHigh4 and high > low then high else Double.NaN;
BullBreak.SetPaintingStrategy(PaintingStrategy.ARROW_UP);
BullBreak.SetDefaultColor(Color.CYAN);
BullBreak.SetLineWeight(3);

#================= 6. VWAP REFERENCE LINE (anchored, multi-timeframe) =================
input showVWAP = yes;
input vwapTimeFrame = {default DAY, WEEK, MONTH};

def cap = GetAggregationPeriod();
def errorInAggregation =
    vwapTimeFrame == vwapTimeFrame.DAY and cap >= AggregationPeriod.WEEK or
    vwapTimeFrame == vwapTimeFrame.WEEK and cap >= AggregationPeriod.MONTH;
Assert(!errorInAggregation, "vwapTimeFrame should not be less than current chart aggregation period");

def yyyyMmDd = GetYyyyMmDd();
def periodIndx;
switch (vwapTimeFrame) {
case DAY:
    periodIndx = yyyyMmDd;
case WEEK:
    periodIndx = Floor((DaysFromDate(First(yyyyMmDd)) + GetDayOfWeek(First(yyyyMmDd))) / 7);
case MONTH:
    periodIndx = RoundDown(yyyyMmDd / 100, 0);
}
def isPeriodRolled = CompoundValue(1, periodIndx != periodIndx[1], yes);

def volumeSum;
def volumeVwapSum;
def volumeVwap2Sum;
if (isPeriodRolled) {
    volumeSum = volume;
    volumeVwapSum = volume * vwap;
    volumeVwap2Sum = volume * Sqr(vwap);
} else {
    volumeSum = CompoundValue(1, volumeSum[1] + volume, volume);
    volumeVwapSum = CompoundValue(1, volumeVwapSum[1] + volume * vwap, volume * vwap);
    volumeVwap2Sum = CompoundValue(1, volumeVwap2Sum[1] + volume * Sqr(vwap), volume * Sqr(vwap));
}
def vwapPrice = volumeVwapSum / volumeSum;

plot VWAP = if showVWAP then vwapPrice else Double.NaN;
VWAP.SetDefaultColor(Color.YELLOW);
VWAP.SetStyle(Curve.SHORT_DASH);
VWAP.SetLineWeight(3);

#================= 7. EMA STACK TREND STRENGTH =================
input esLen1 = 8;
input esLen2 = 13;
input esLen3 = 21;
input esLen4 = 34;

def esEma1 = ExpAverage(close, esLen1);
def esEma2 = ExpAverage(close, esLen2);
def esEma3 = ExpAverage(close, esLen3);
def esEma4 = ExpAverage(close, esLen4);

def esUp1 = esEma1 > esEma2;
def esUp2 = esEma2 > esEma3;
def esUp3 = esEma3 > esEma4;
def esDown1 = esEma1 < esEma2;
def esDown2 = esEma2 < esEma3;
def esDown3 = esEma3 < esEma4;

def emaStackTrend = if esUp1 and esUp2 and esUp3 then 2
                     else if esUp1 and esUp2 and !esUp3 then 1
                     else if esDown1 and esDown2 and esDown3 then -2
                     else if esDown1 and esDown2 and !esDown3 then -1
                     else 0;

#================= 8. HIGH VOLUME DOTS =================
input showVolumeDot = yes;
input volumeAvgLength = 13;
input volumePercentThreshold = 21;

def averageVolume = Average(volume, volumeAvgLength);
def percentVolume = 100 * ((volume - averageVolume[1]) / averageVolume[1]);
def highVolume = percentVolume >= volumePercentThreshold;

plot VolumeDot = if showVolumeDot and highVolume then hl2 else Double.NaN;
VolumeDot.SetPaintingStrategy(PaintingStrategy.POINTS);
VolumeDot.SetLineWeight(5);
VolumeDot.SetDefaultColor(Color.ORANGE);

#================= LABELS (replace the old plotted trend lines) =================
def votesUp = (if upVotes > dnVotes then 1 else 0) + (if dmiSlope > 0.1 then 1 else 0) +
              (if haTrendUp then 1 else 0) + (if emaSlope > 0.2 then 1 else 0) +
              (if emaStackTrend > 0 then 1 else 0);
def votesDn = (if upVotes < dnVotes then 1 else 0) + (if dmiSlope < -0.1 then 1 else 0) +
              (if !haTrendUp then 1 else 0) + (if emaSlope < -0.2 then 1 else 0) +
              (if emaStackTrend < 0 then 1 else 0);

AddLabel(showLabels, "AGAIG Trend Overall", Color.WHITE);

AddLabel(showLabels,
    "Primary Trend: " + (if upVotes > dnVotes then "UP" else if upVotes < dnVotes then "DOWN" else "FLAT"),
    if upVotes > dnVotes then Color.GREEN else if upVotes < dnVotes then Color.RED else Color.Yellow);

AddLabel(showLabels,
    "HA Trend: " + (if haTrendUp then "UP" else "DOWN"),
    if haTrendUp then Color.GREEN else Color.RED);

AddLabel(showLabels,
    "EMA Trend: " + (if emaSlope > 0.2 then "UP" else if emaSlope < -0.2 then "DOWN" else "FLAT"),
    if emaSlope > 0.2 then Color.GREEN else if emaSlope < -0.2 then Color.RED else Color.YELLOW);

AddLabel(showLabels,
    "EMA Stack: " + (if emaStackTrend == 2 then "STRONG UP" else if emaStackTrend == 1 then "UP" else if emaStackTrend == -2 then "STRONG DOWN" else if emaStackTrend == -1 then "DOWN" else "FLAT"),
    if emaStackTrend > 0 then Color.GREEN else if emaStackTrend < 0 then Color.RED else Color.Yellow);

#Consensus is placed last so it's the bottom label on the chart. AddLabel only
#accepts (visible, text, color) - there's no location/fontsize parameter, so
#stack position + a visual marker is how you make one label stand out.
AddLabel(showLabels,
    "CONSENSUS: " + votesUp + " Up / " + votesDn + " Down",
    if votesUp > votesDn then Color.GREEN else if votesDn > votesUp then Color.RED else Color.Yellow, labellocation, labelsize);

#End Study
Last edited by a moderator:

