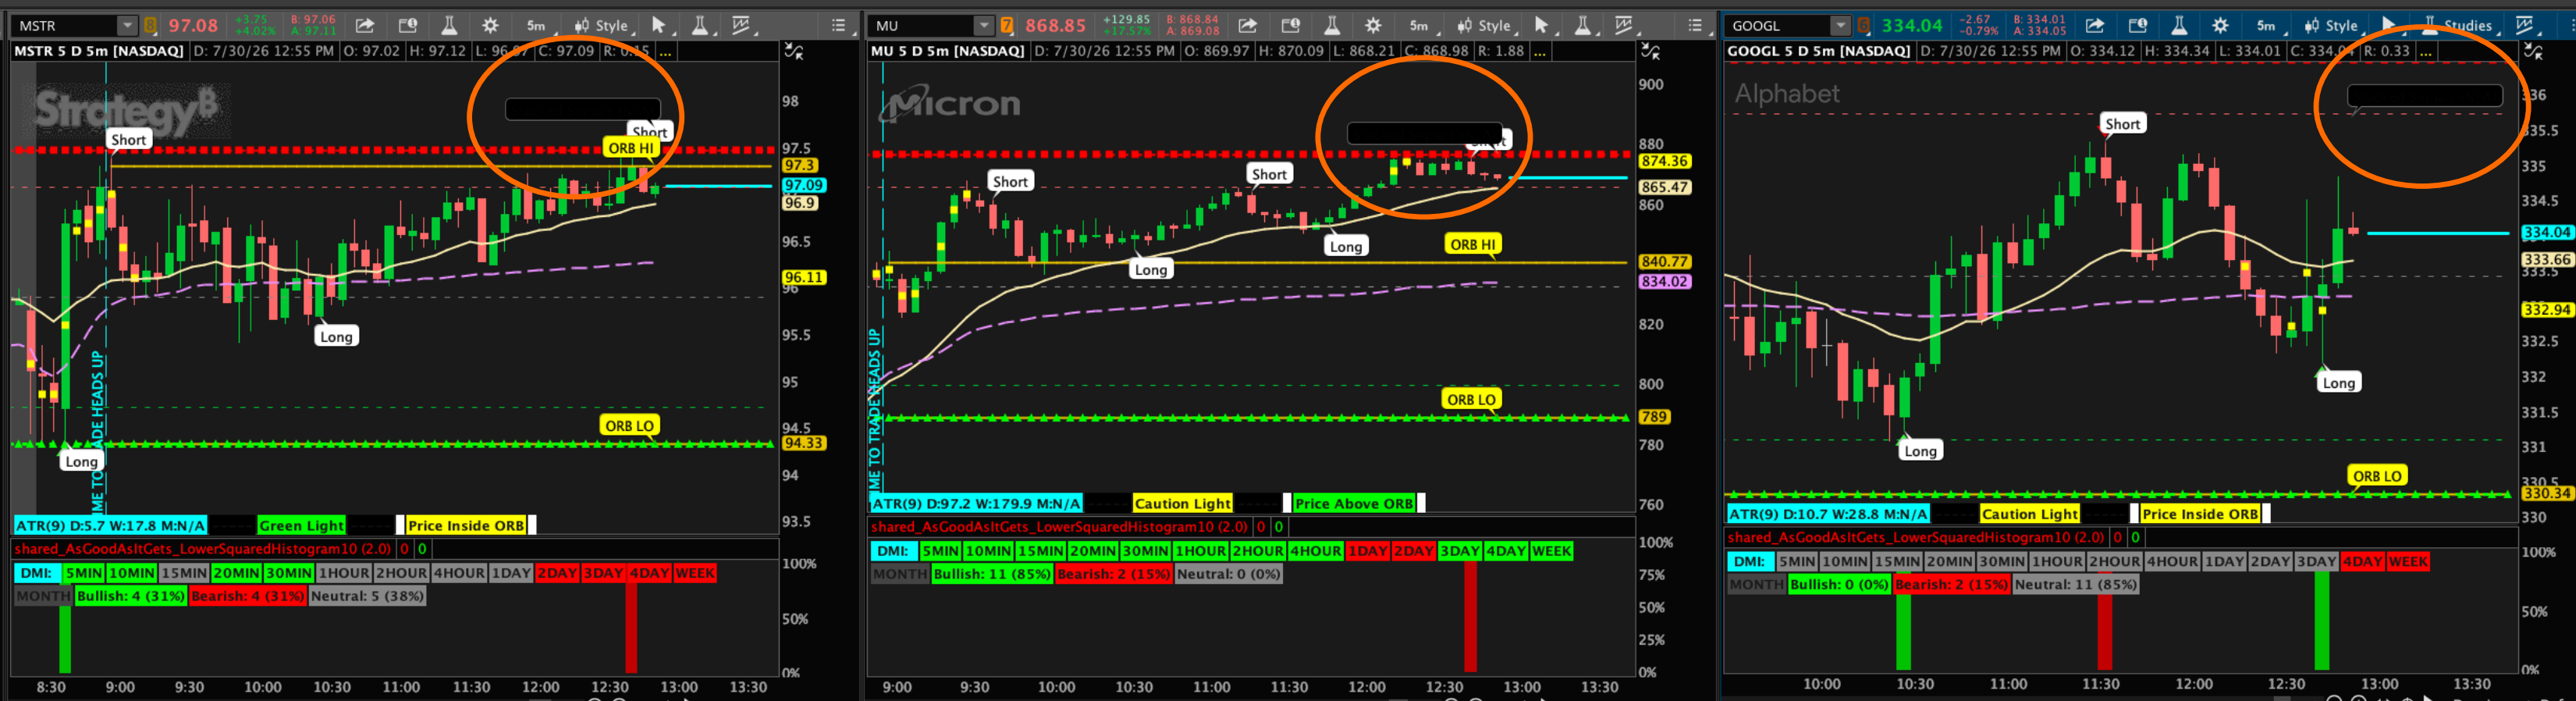
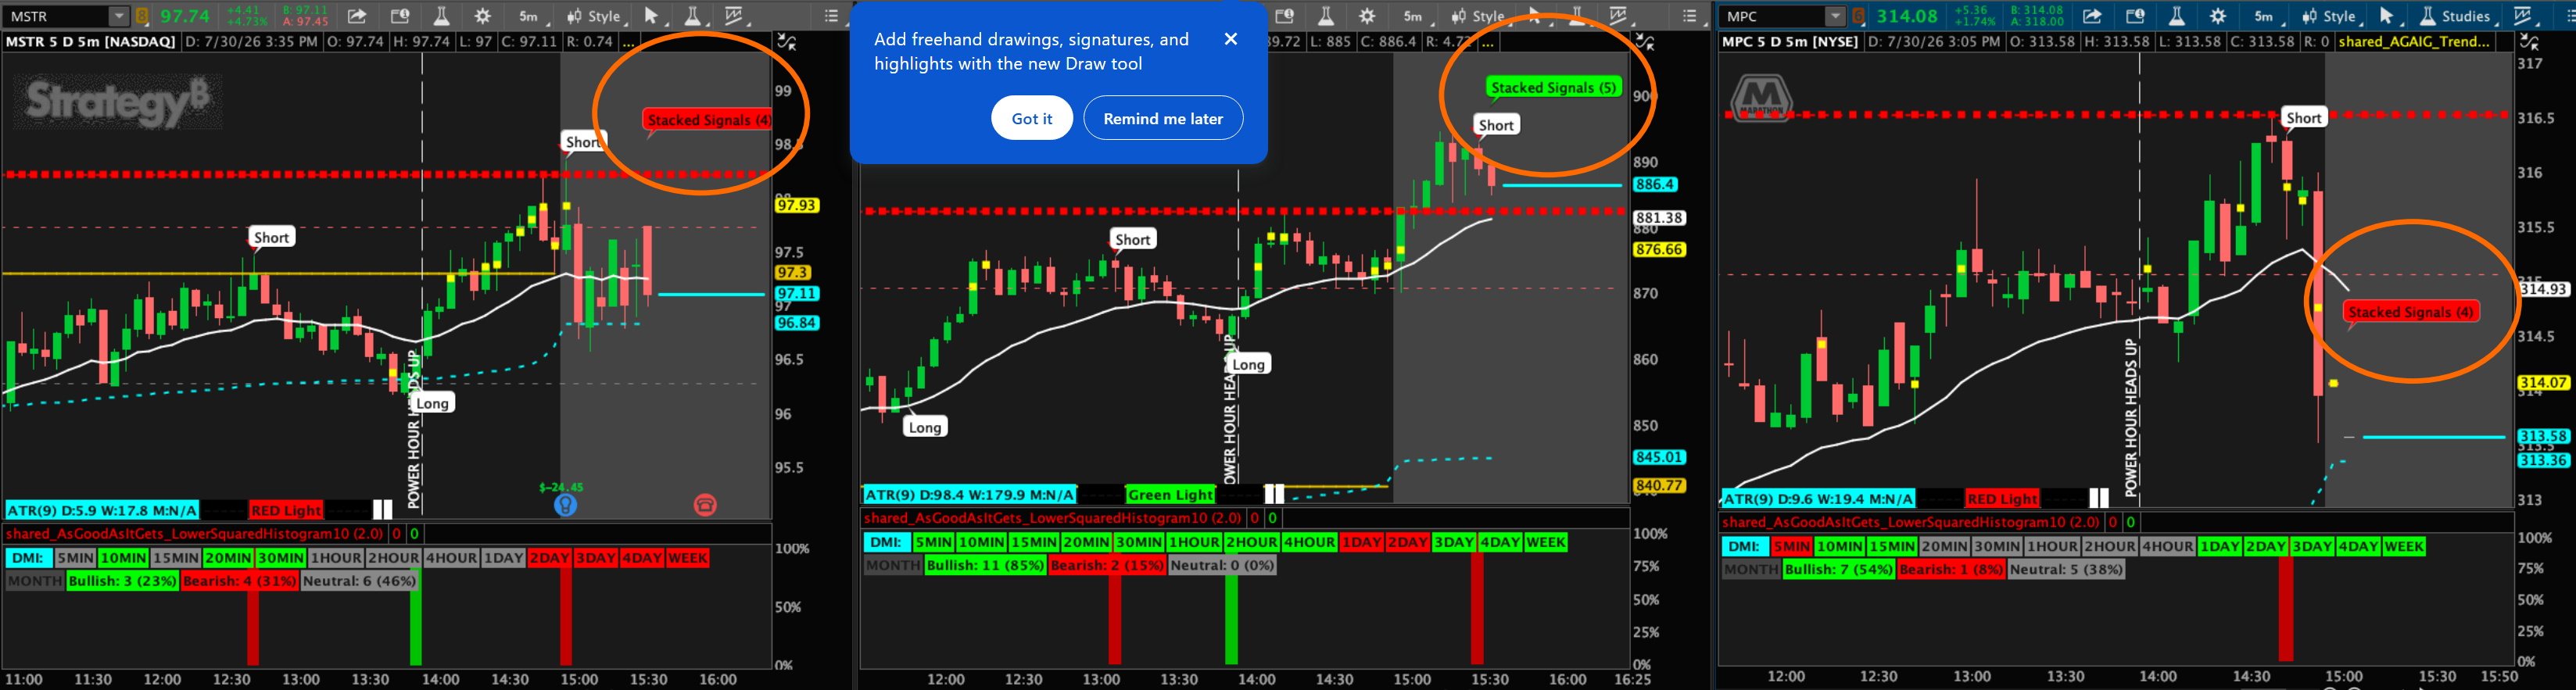
AGAIG STACKED SIGNALS INDICATOR FOR TOS
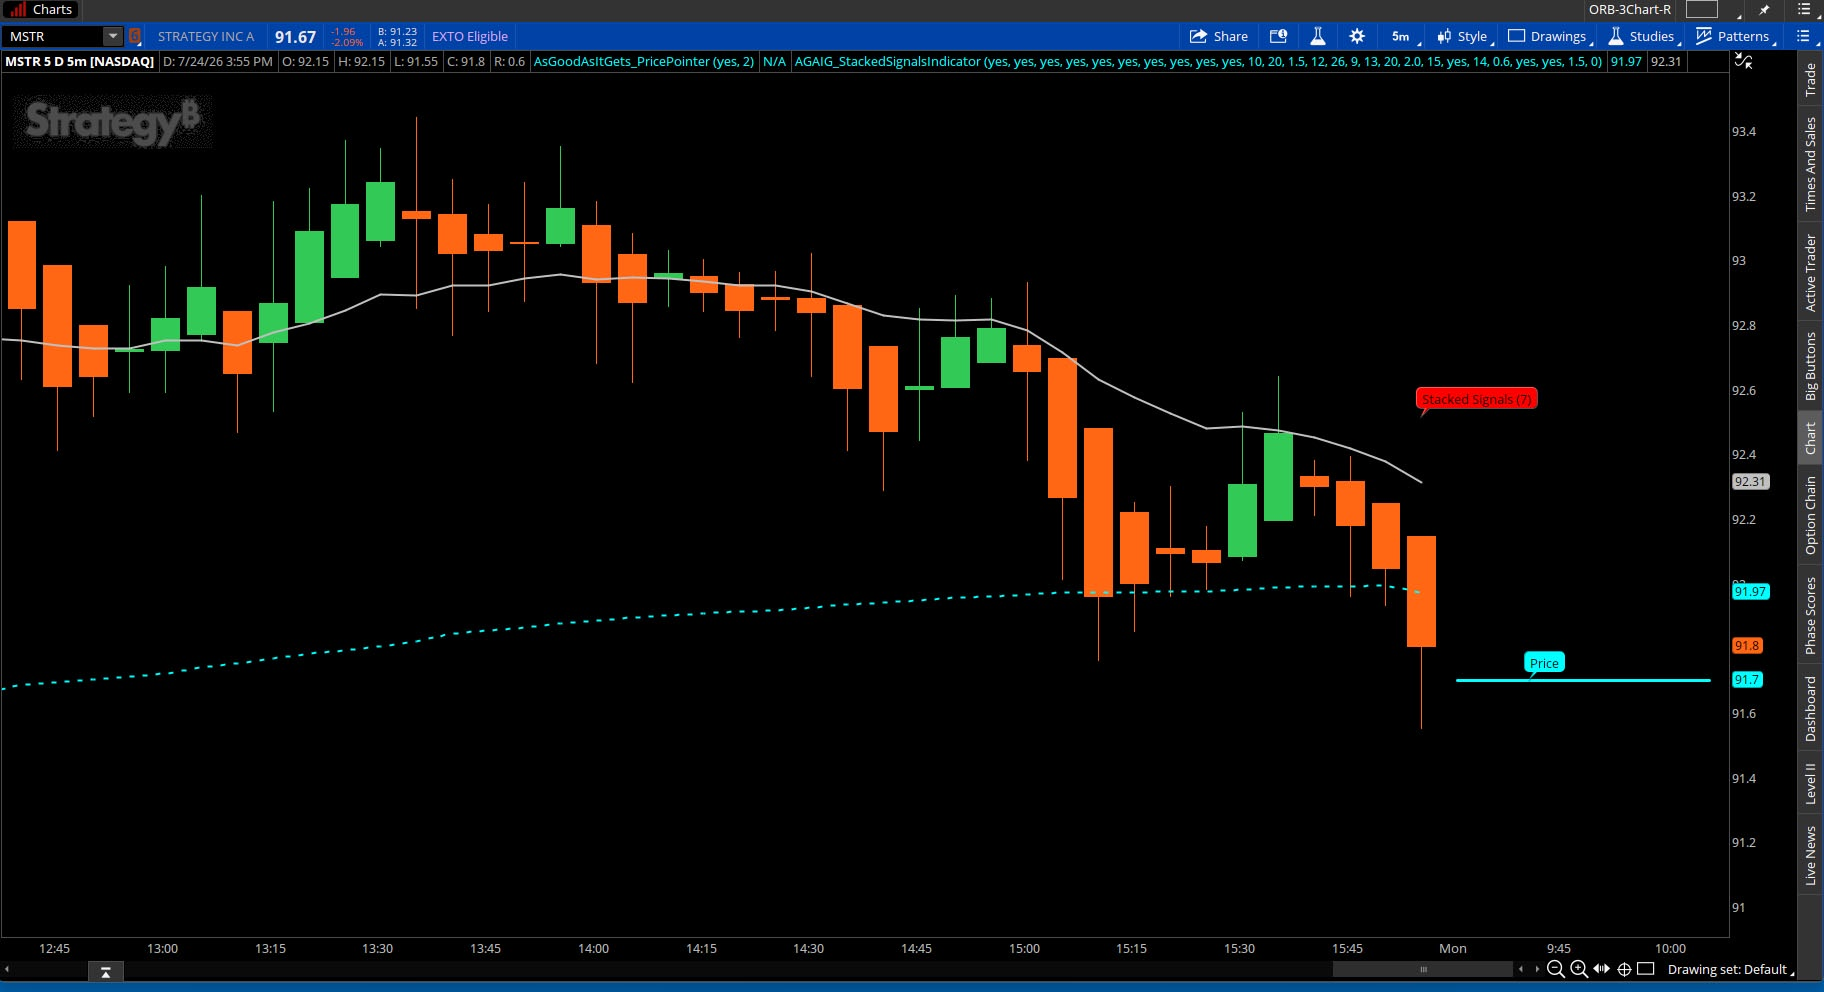
As a trading rule we recommend that two (or more) indicators be in agreement before placing a trade. With this indicator we are actually looking at eight indicators to see what each one is suggesting a change in direction. This indicator overall produces a BUBBLE on the chart showing what direction the indicators are suggesting, and most importantly, how many are showing the same direction by placing the number that agree within the Stacked Signals BUBBLE ( ).
This is an adjustable indicator where you can go into “Added studies and strategies”, go down to AGAIG_StackedSignalsIndicator, click on the wheel at the right and turn off/on any of the parameters you want to monitor by using the yes/no drop down. I use this indicator mostly as a monitoring tool.
This is how to use this indicator for trading purposes if you so choose.
AGAIG Stacked Signals — Quick Use
Look at the bubble color.
 Yellow = stand aside (not enough agreement, or outside market hours)
 Light Green = 2 signals agree bullish Green = 3+ signals agree bullish
 Light Red = 2 signals agree bearish Red = 3+ signals agree bearish
Check the number in parentheses. That's how many of the 8 indicators (VWAP, momentum, volume, wick, MACD, Laguerre RSI, Bollinger, ORB,) currently agree.
Glance at the 20 EMA. Not a vote — just a heads-up where price is in relation to the 20 EMA, or that price is nearing a frequent turn zone.
Only trade on green or red. Yellow means wait. That's it!
That's the whole workflow: glance at color, glance at number, act only on green/red.
Regular hours only. "For use during regular trading hours (9:30am–4:00pm ET) only. The vote count and color reflect live conditions during the session; the indicator does not display outside regular hours. Treat the last reading shown before the close as your end-of-day signal."
NOTE: This BUBBLE shows during trading hours and updates as parameters change.
I hope it is helpful and as always feedback is appreciated.
Code:
# AGAIG STACKED SIGNALS INDICATOR
# ---------------------------------------------------------------
# Chart plots ONLY:
#   - VWAP   (also counts as one of the 8 votes below -- see note)
#   - 20 EMA (heads-up reference -- the 21 EMA is your frequent turn point,
#             this gives early warning before price reaches it)
#
# Everything below is a VOTE, including VWAP -- no single indicator gets
# to override the others. Each of the 8 casts a bullish, bearish, or no
# vote on the current bar. Stacked Signals counts how many agree with
# whichever side (bull or bear) currently has more votes; a tie is chop.
#
#   0-1 votes   = YELLOW        ("Chop" -- stand aside)
#   2 votes     = LIGHT GREEN / LIGHT RED   ("Two in agreement")
#   3+ votes    = GREEN / RED   ("Three or more in agreement")
#
# An ATR filter (your "ATR 2.5" idea) sits underneath everything as a
# gate: if the current bar's true range is too small relative to ATR,
# the whole thing is forced to chop regardless of vote count. Quiet,
# directionless bars shouldn't be able to rack up a signal count.
# ---------------------------------------------------------------

declare upper;

# ============================ CHART PLOTS ============================
input showVWAP = yes;
def vwapVal = reference VWAP();
plot VWAPPlot = if showVWAP then vwapVal else Double.NaN;
VWAPPlot.SetDefaultColor(Color.CYAN);
VWAPPlot.SetLineWeight(2);
VWAPPlot.SetStyle(Curve.SHORT_DASH);

input show20EMA = yes;
def ema20 = ExpAverage(close, 20);
plot EMA20Plot = if show20EMA then ema20 else Double.NaN;
EMA20Plot.SetDefaultColor(Color.White);
EMA20Plot.SetLineWeight(2);

# ============================ VOTE ON/OFF TOGGLES ============================
input useVWAPVote   = yes;
input useMomentum   = yes;
input useVolume     = yes;
input useWickShadow = yes;
input useMACD       = yes;
input useLaguerre   = yes;
input useBollinger  = yes;
input useORB        = yes;

# =========================== VOTE PARAMETERS ===========================
input momentumLength = 10;

input volumeAvgLength = 20;

input wickBodyMultiple = 1.5; #Hint wickBodyMultiple: how many times longer than the body a wick must be to count as a rejection.

input macdFastLength = 12;
input macdSlowLength = 26;
input macdSignalLength = 9;

input laguerreNFE = 13; #Hint laguerreNFE: lookback for the Fractal Energy gamma calc, same as the Laguerre indicator.

input bollingerLength = 20;
input bollingerNumDevs = 2.0;

input orbMinutes = 15; #Hint orbMinutes: length of the opening range in minutes, starting at 9:30 ET.

# ============================ ATR CHOP FILTER ============================
input useATRFilter = yes;
input atrLength = 14;
input atrMinMultiple = 0.6; #Hint atrMinMultiple: current true range must be at least this multiple of ATR to allow votes to count at all.

# ============================ REGULAR HOURS FILTER ============================
input restrictToRegularHours = yes; #Hint restrictToRegularHours: yes = the bubble only draws during 9:30am-4:00pm ET. Since bubbles stay anchored to the bar they were drawn on, the last one from the trading day simply remains visible afterward -- nothing new is computed or drawn after hours. no = tracks live around the clock with no restriction.

def inRegularHours = SecondsFromTime(0930) >= 0 and SecondsTillTime(1600) > 0;

def atrVal = WildersAverage(TrueRange(high, close, low), atrLength);
def atrOK = !useATRFilter or TrueRange(high, close, low) >= atrVal * atrMinMultiple;

# ============================ VOTE 1: VWAP ============================
def aboveVWAP = close > vwapVal;
def belowVWAP = close < vwapVal;
def vwapBull = useVWAPVote and aboveVWAP;
def vwapBear = useVWAPVote and belowVWAP;

# ============================ VOTE 2: MOMENTUM ============================
def momVal = close - close[momentumLength];
def momBull = useMomentum and momVal > 0;
def momBear = useMomentum and momVal < 0;

# ============================ VOTE 3: VOLUME ============================
def volAvg = Average(volume, volumeAvgLength);
def volBull = useVolume and volume > volAvg and close > open;
def volBear = useVolume and volume > volAvg and close < open;

# ============================ VOTE 4: WICK / SHADOW ============================
def body = AbsValue(close - open);
def upperWick = high - Max(close, open);
def lowerWick = Min(close, open) - low;
def wickBull = useWickShadow and lowerWick > body * wickBodyMultiple;
def wickBear = useWickShadow and upperWick > body * wickBodyMultiple;

# ============================ VOTE 5: MACD ============================
def emaFastMACD = ExpAverage(close, macdFastLength);
def emaSlowMACD = ExpAverage(close, macdSlowLength);
def macdLine = emaFastMACD - emaSlowMACD;
def macdSignalLine = ExpAverage(macdLine, macdSignalLength);
def macdBull = useMACD and macdLine > macdSignalLine;
def macdBear = useMACD and macdLine < macdSignalLine;

# ============================ VOTE 6: LAGUERRE GAMMA-WEIGHTED RSI ============================
def oL = (open + close[1]) / 2;
def hL = Max(high, close[1]);
def lL = Min(low, close[1]);
def cL = (oL + hL + lL + close) / 4;

def gammaL = Log(Sum((Max(high, close[1]) - Min(low, close[1])), laguerreNFE) /
    (Highest(high, laguerreNFE) - Lowest(low, laguerreNFE))) / Log(laguerreNFE);

def L0;
def L1;
def L2;
def L3;
def CU1;
def CU2;
def CUf;
def CD1;
def CD2;
def CDf;

L0 = (1 - gammaL) * cL + gammaL * L0[1];
L1 = -gammaL * L0 + L0[1] + gammaL * L1[1];
L2 = -gammaL * L1 + L1[1] + gammaL * L2[1];
L3 = -gammaL * L2 + L2[1] + gammaL * L3[1];

if L0 >= L1 {
    CU1 = L0 - L1;
    CD1 = 0;
} else {
    CD1 = L1 - L0;
    CU1 = 0;
}
if L1 >= L2 {
    CU2 = CU1 + L1 - L2;
    CD2 = CD1;
} else {
    CD2 = CD1 + L2 - L1;
    CU2 = CU1;
}
if L2 >= L3 {
    CUf = CU2 + L2 - L3;
    CDf = CD2;
} else {
    CUf = CU2;
    CDf = CD2 + L3 - L2;
}

def laguerreRSI = if CUf + CDf <> 0 then CUf / (CUf + CDf) else 0.5;
def laguerreBull = useLaguerre and laguerreRSI > 0.5;
def laguerreBear = useLaguerre and laguerreRSI < 0.5;

# ============================ VOTE 7: BOLLINGER BANDS ============================
def bbBasis = Average(close, bollingerLength);
def bbDev = StDev(close, bollingerLength);
def bbUpper = bbBasis + bollingerNumDevs * bbDev;
def bbLower = bbBasis - bollingerNumDevs * bbDev;
def bbBull = useBollinger and close > bbBasis;
def bbBear = useBollinger and close < bbBasis;

# ============================ VOTE 8: OPENING RANGE BREAKOUT (ORB) ============================
def newDay = GetDay() != GetDay()[1];
def inORBWindow = SecondsFromTime(0930) >= 0 and SecondsFromTime(0930) <= orbMinutes * 60;

def orbHigh = CompoundValue(1,
    if newDay then (if inORBWindow then high else Double.NaN)
    else if inORBWindow then Max(high, orbHigh[1])
    else orbHigh[1],
    Double.NaN);

def orbLow = CompoundValue(1,
    if newDay then (if inORBWindow then low else Double.NaN)
    else if inORBWindow then Min(low, orbLow[1])
    else orbLow[1],
    Double.NaN);

def orbBull = if !useORB then no else if IsNaN(orbHigh) then no else close > orbHigh;
def orbBear = if !useORB then no else if IsNaN(orbLow) then no else close < orbLow;

# ============================ TALLY VOTES ============================
def bullVotes = (if vwapBull then 1 else 0) + (if momBull then 1 else 0) + (if volBull then 1 else 0) + (if wickBull then 1 else 0) +
    (if macdBull then 1 else 0) + (if laguerreBull then 1 else 0) + (if bbBull then 1 else 0) + (if orbBull then 1 else 0);

def bearVotes = (if vwapBear then 1 else 0) + (if momBear then 1 else 0) + (if volBear then 1 else 0) + (if wickBear then 1 else 0) +
    (if macdBear then 1 else 0) + (if laguerreBear then 1 else 0) + (if bbBear then 1 else 0) + (if orbBear then 1 else 0);

# ============================ DIRECTION & COUNT ============================
def isTie = bullVotes == bearVotes;
def dominantIsBull = bullVotes > bearVotes;
def dominantCount = Max(bullVotes, bearVotes);

def stackedCount = if !atrOK or isTie then 0 else dominantCount;
def signalTier = if stackedCount < 2 then 0 else if stackedCount == 2 then 1 else 2;
# 0 = chop, 1 = two in agreement, 2 = three-plus in agreement

# Flat color code -- avoids nested if-expressions, which AddLabel handles poorly:
# 0 = yellow (chop/tie/filtered), 1 = light green, 2 = green, 3 = light red, 4 = red
def colorCode =
    if !atrOK or isTie then 0
    else if dominantIsBull and signalTier == 0 then 0
    else if dominantIsBull and signalTier == 1 then 1
    else if dominantIsBull then 2
    else if signalTier == 0 then 0
    else if signalTier == 1 then 3
    else 4;

# ============================ LABEL POSITIONING ============================
input labelAboveCandles = yes; #Hint labelAboveCandles: yes places the label above price, no places it below.
input labelOffsetATRMult = 1.5; #Hint labelOffsetATRMult: vertical distance from price, measured in ATR multiples -- raise this to push the label further away from candles.
input labelBarsFromRightEdge = 0; #Hint labelBarsFromRightEdge: how many bars in from the current bar the label sits. 0 = the live/current bar. Raise this only if you want it to sit further left instead of tracking live.

def isLabelBar = (!IsNaN(close[-labelBarsFromRightEdge]) and IsNaN(close[-(labelBarsFromRightEdge + 1)]))
    and (!restrictToRegularHours or inRegularHours);
# Tracks live throughout the trading day. Simply doesn't draw outside RTH --
# no attempt to freeze or hold a final snapshot, since that approach proved
# unreliable in ToS's bubble renderer. Best practice: don't rely on this
# indicator outside 9:30am-4:00pm ET; treat the last reading you saw before
# the close as your end-of-day read.

# Fallback keeps the bubble drawable even before ATR has enough bars to warm up --
# without this, a NaN atrVal produces a NaN price and the bubble renders as a
# stray black box or doesn't show at all.
def labelPrice =
    if IsNaN(atrVal) then (if labelAboveCandles then high * 1.005 else low * 0.995)
    else if labelAboveCandles then high + labelOffsetATRMult * atrVal
    else low - labelOffsetATRMult * atrVal;

AddChartBubble(isLabelBar, labelPrice, "Stacked Signals (" + stackedCount + ")",
    if colorCode == 0 then Color.YELLOW
    else if colorCode == 1 then Color.LIGHT_GREEN
    else if colorCode == 2 then Color.GREEN
    else if colorCode == 3 then Color.LIGHT_RED
    else Color.RED,
    labelAboveCandles);
Last edited: