

AGAIG SPY OVERNIGHT TRADING INDICATOR
This is a new indicator whose purpose is to place trades on the SPY two days out (2 DTE) near the end of current trading day. The object of the trade is to close it the next day for a profit and not let it run the last day.
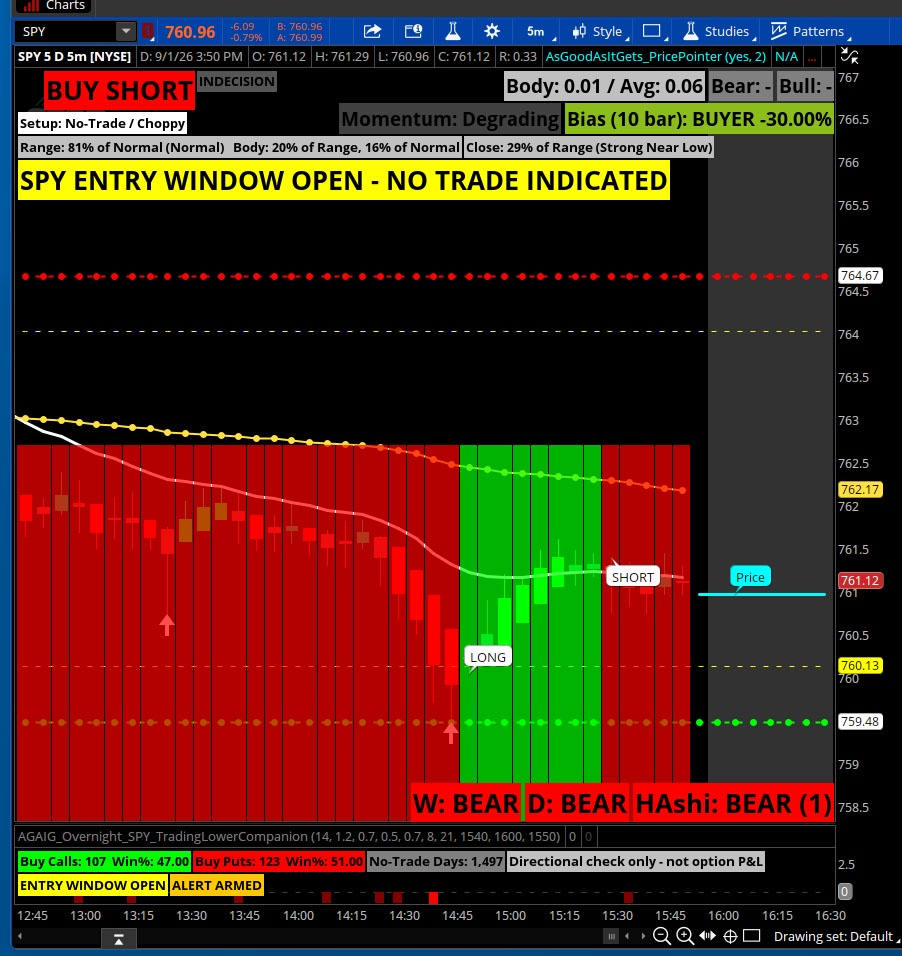
As the indicator is currently set the “SPY ENTRY WINDOW OPEN” shows on the chart at 3:40 p.m. when one of three choices will show at 3:50 p.m.: “BUY CALL INDICATED”, “BUY PUT INDICATED”, or “NO TRADE INDICATED.” We are placing trades (if any) close to the end of the trading day. Window entry time closes at 4:15 p.m. (all of the times can be personally set in the “Added studies and strategies” dropdown by clicking on the wheel at end of indicator.
This indicator Works correctly on ANY chart aggregation (5-min, 1-min, Daily, etc.) because all inputs are explicitly pulled from the DAILY period using period-adjusted price functions (e.g. close(period = AggregationPeriod.DAY)), with historical offsets [1], [2]... correctly referencing prior CALENDAR DAYS regardless of the chart's own bar size.
These types of trades are only normally placed from a Daily Chart, however many of us use different time frames and would like the information to show on our SPY chart regardless of time frame being utilized. There is a trade-off for using any time frame as follows:
- ATR uses a Simple Moving Average of daily True Range (not Wilders), computed via an explicit fold over day offsets - this avoids the recursive-recalculation distortion that Wilders/EMA would suffer from being re-evaluated on every intraday bar.
- Momentum filter uses SMA(8)/SMA(21) of daily closes instead of EMA(8)/EMA(21), for the same reason. These are directionally very similar to the original Wilders/EMA versions but are exact and stable regardless of chart timeframe.
In short you can add this study to your normal 5-min (or any time frame) chart. The labels and arrows reflect TODAY's still-forming daily bar in real time, so
they are most meaningful to act on during the 3:45-4:00 PM ET window (although they stay open until $:15 ET) and you can turn them off/on so that they only show during the last half hour of trading or not at all.
NOTE: “No-Trade” days are a real, intended outcome, not a failure of the system.
The Indicator Link: http://tos.mx/!CD4OhYiM
Here is the chart label look from yesterday at close:
I have also made an indicator for the QQQ and will post soon.
Some commentary on the above SPY Labels:
WHY DID IT LAND ON “NO TRADE”
SPY: Range 81% of Normal sits in the neutral zone (between your 70% contraction and 120% expansion thresholds), so this isn't a breakout day. Close was strong near the low (29%, under your 30% threshold) — that part looked bearish. But Body was only 20% of Range, well under the 50% confirmation minimum. So despite a legitimately weak close, the day didn't have enough follow-through in the actual candle body to confirm it — likely a lot of intraday chop/wick rather than a clean sell-off.
Feedback is always appreciated!
Code:
#
# Overnight SPY Trader - Setup Classifier (Timeframe-Agnostic)
# ------------------------------------------------------------------
# Works correctly on ANY chart aggregation (5-min, 1-min, Daily, etc.)
# because all inputs are explicitly pulled from the DAILY period using
# period-adjusted price functions (e.g. close(period = AggregationPeriod.DAY)),
# with historical offsets [1], [2]... correctly referencing prior CALENDAR
# DAYS regardless of the chart's own bar size.
#
# TRADE-OFF vs the original Daily-only version:
#   - ATR uses a Simple Moving Average of daily True Range (not Wilders),
#     computed via an explicit fold over day offsets - this avoids the
#     recursive-recalculation distortion that Wilders/EMA would suffer
#     from being re-evaluated on every intraday bar.
#   - Momentum filter uses SMA(8)/SMA(21) of daily closes instead of
#     EMA(8)/EMA(21), for the same reason.
# These are directionally very similar to the original Wilders/EMA
# versions but are exact and stable regardless of chart timeframe.
#
# Usage: add this study to your normal 5-min (or any) chart. The labels
# and arrows reflect TODAY's still-forming daily bar in real time, so
# they are most meaningful to act on during the 3:45-4:00 PM ET window,
# same as the Daily-only version.
# ------------------------------------------------------------------

declare upper;

input LabelSize     = fontsize.large;
input LabelLocation = location.top_left;


input atrLength = 14;
input rangeExpansionMult = 1.2;
input rangeContractionMult = 0.7;
input bodyConfirmMin = 0.5;
input closeStrongThreshold = 0.7;
input fastLength = 8;
input slowLength = 21;
input entryWindowStartTime = 1540;  # 3:40 PM ET - visual "window open" label starts here
input entryWindowEndTime = 1615;    # 4:00 PM ET - hard cutoff; do NOT extend past this,
                                    # since SPY shares stop trading at 4:00 and the option's
                                    # 4:00-4:15 window is for closing/hedging, not new entries
input alertTime = 1550;             # 3:50 PM ET - alert notification fires here (later than
                                    # the visual window open, giving data more time to settle)
input showLabels = yes;             # master on/off toggle for status & diagnostic labels
input labelsStartTime = 1530;       # 3:30 PM ET - labels stay hidden before this time,
                                    # since Body%/ClosePos% readings aren't meaningful until
                                    # the day is nearly done (see comments below)

# ---------- Pull true daily OHLC regardless of chart timeframe ----------
def dOpen = open(period = AggregationPeriod.DAY);
def dHigh = high(period = AggregationPeriod.DAY);
def dLow = low(period = AggregationPeriod.DAY);
def dClose = close(period = AggregationPeriod.DAY);

# ---------- Today's (still-forming) daily bar measurements ----------
def rng = dHigh - dLow;
def tr = TrueRange(dHigh, dClose[1], dLow);
def body = AbsValue(dClose - dOpen);
def bodyRatio = if rng != 0 then body / rng else 0;
def closePos = if rng != 0 then (dClose - dLow) / rng else 0.5;
def bullishCandle = dClose > dOpen;
def bearishCandle = dClose < dOpen;

# ---------- ATR: Simple Moving Average of daily True Range over the ----------
# ---------- last `atrLength` COMPLETED days (excludes today, i=0) ----------
def sumTR = fold i = 1 to atrLength + 1 with s = 0
    do s + TrueRange(GetValue(dHigh, i),
                      GetValue(dClose, i + 1),
                      GetValue(dLow, i));
def atr = sumTR / atrLength;
def rangeRatio = if atr != 0 then rng / atr else 0;

# ---------- Momentum: SMA(fastLength) vs SMA(slowLength) of daily closes ----------
# ---------- (includes today's still-forming close, like the original EMA did) ----------
def sumFast = fold f = 0 to fastLength with sf = 0
    do sf + GetValue(dClose, f);
def maFast = sumFast / fastLength;

def sumSlow = fold sl = 0 to slowLength with ss = 0
    do ss + GetValue(dClose, sl);
def maSlow = sumSlow / slowLength;

def momentumBull = maFast > maSlow;
def momentumBear = maFast < maSlow;

def closedStrongHigh = closePos >= closeStrongThreshold;
def closedStrongLow = closePos <= (1 - closeStrongThreshold);

def expansion = rangeRatio >= rangeExpansionMult;
def contraction = rangeRatio <= rangeContractionMult;
def confirmedBody = bodyRatio >= bodyConfirmMin;

# ---------- Five categories ----------
def catBreakoutBull      = expansion and bullishCandle and closedStrongHigh and momentumBull and confirmedBody;
def catBreakoutBear      = expansion and bearishCandle and closedStrongLow and momentumBear and confirmedBody;
def catContinuationBull  = !expansion and !contraction and momentumBull and closedStrongHigh and bullishCandle and confirmedBody;
def catContinuationBear  = !expansion and !contraction and momentumBear and closedStrongLow and bearishCandle and confirmedBody;
def catNoTrade = !(catBreakoutBull or catBreakoutBear or catContinuationBull or catContinuationBear);

def buySignal = catBreakoutBull or catContinuationBull;
def sellSignal = catBreakoutBear or catContinuationBear;

# ---------- Plots (placed relative to the CURRENT chart bar's own range, ----------
# ---------- so they sit sensibly close to price on any timeframe) ----------
def barRng = high - low;
plot BuyArrow = if buySignal then low - barRng * 0.5 else Double.NaN;
BuyArrow.SetPaintingStrategy(PaintingStrategy.ARROW_UP);
BuyArrow.SetDefaultColor(Color.GREEN);
BuyArrow.SetLineWeight(3);
BuyArrow.SetHiding(no);

plot SellArrow = if sellSignal then high + barRng * 0.5 else Double.NaN;
SellArrow.SetPaintingStrategy(PaintingStrategy.ARROW_DOWN);
SellArrow.SetDefaultColor(Color.RED);
SellArrow.SetLineWeight(3);
SellArrow.SetHiding(no);

# ---------- Labels ----------
def labelsVisible = showLabels and SecondsFromTime(labelsStartTime) >= 0;

AddLabel(
    labelsVisible,
    if buySignal then "BUY CALL (2DTE)"
    else if sellSignal then "BUY PUT (2DTE)"
    else "NO TRADE",
    if buySignal then Color.GREEN
    else if sellSignal then Color.RED
    else Color.GRAY
);

AddLabel(
    labelsVisible,
    "Setup: " +
        (if catBreakoutBull then "Breakout - Bullish"
         else if catBreakoutBear then "Breakout - Bearish"
         else if catContinuationBull then "Continuation - Bullish"
         else if catContinuationBear then "Continuation - Bearish"
         else "No-Trade / Choppy"),
    Color.WHITE
);

def rangePctOfNormal = Round(rangeRatio * 100, 0);
def bodyPctOfRange = Round(bodyRatio * 100, 0);
def bodyPctOfNormal = if atr != 0 then Round(body / atr * 100, 0) else 0;
def closePosPct = Round(closePos * 100, 0);

AddLabel(
    labelsVisible,
    "Range: " + rangePctOfNormal + "% of Normal (" +
        (if expansion then "Expanded" else if contraction then "Compressed" else "Normal") +
        ")   Body: " + bodyPctOfRange + "% of Range, " + bodyPctOfNormal + "% of Normal",
    Color.LIGHT_GRAY
);

AddLabel(
    labelsVisible,
    "Close: " + closePosPct + "% of Range (" +
        (if closedStrongHigh then "Strong Near High" else if closedStrongLow then "Strong Near Low" else "Mid-Range") +
        ")",
    Color.LIGHT_GRAY
);

def entryWindow = SecondsFromTime(alertTime) >= 0 and SecondsTillTime(entryWindowEndTime) >= 0;
AddLabel(
    entryWindow,
    "SPY ENTRY WINDOW OPEN - " +
        (if buySignal then "BUY CALL INDICATED"
         else if sellSignal then "BUY PUT INDICATED"
         else "NO TRADE INDICATED"),
    Color.YELLOW, labellocation, labelsize
);

# ---------- Alerts (fire ONCE, at alertTime, separate from the visual window open) ----------
def alertWindow = SecondsFromTime(alertTime) >= 0 and SecondsTillTime(entryWindowEndTime) >= 0;
def alertJustFired = alertWindow and !alertWindow[1];
Alert(buySignal and alertJustFired, "SPY: Buy Call setup - 2DTE, exit next day 3:45 PM ET", Alert.BAR, Sound.Ring);
Alert(sellSignal and alertJustFired, "SPY: Buy Put setup - 2DTE, exit next day 3:45 PM ET", Alert.BAR, Sound.Ring);
Last edited by a moderator:
