As Good As It Gets
DAY TRADING – SCALPING FOR SUCCESS
So, what is the best way to Day Trade? How do I Day Trade? What stocks (ETFs) are picked, and why do I pick them? How do I know when to enter and/or exit?
The old song “knowing when to hold them, knowing when to fold them, knowing when to walk away and knowing when to run” fits well for an options' day trader!
First of all let’s look at what to trade. I quit trading (for the most part) 0DTE (zero days until expiration) although I have done well with these during my foregone more alert days. Sometimes I will trade the ODE SPY, but not as much as I used to. Too many others work better with less stress and give more flexibility?
I want stocks that:
- move more than five points (ATR) per day (based on a 9 period look back).
- Entries/Exits will be taken when the “intraday” has moved 1.75 - 2.0 of its daily intraday ATR (Intraday Average True Range).
- I mostly trade five contracts at a time.
- This will frequently give me 2-3 trades on the same stock each day.
ATR gives the average movement of the security on a daily, weekly, or monthly basis, but we’re trading intraday and can expect multiple up and down movements within that range during the day with a possible ORB (Opening 15-30 minute Breakout) to the upside or downside.
An added comment if I may: It has been my experience that most stocks close at the edges or within the ORB (15-30 minute Opening Range Breakout). When trading into closing I take this into consideration. I also notice that stocks tend to move towards the VWAP (Volume Weighted Average Price) which to me represents home-base for a security (a frequent area of resistance). I also stated that I trade Friday’s Expirations Monday thru Wednesday and then begin trading the next week out. I actually start the next week out at Wednesday between Noon and 1:00 p.m.
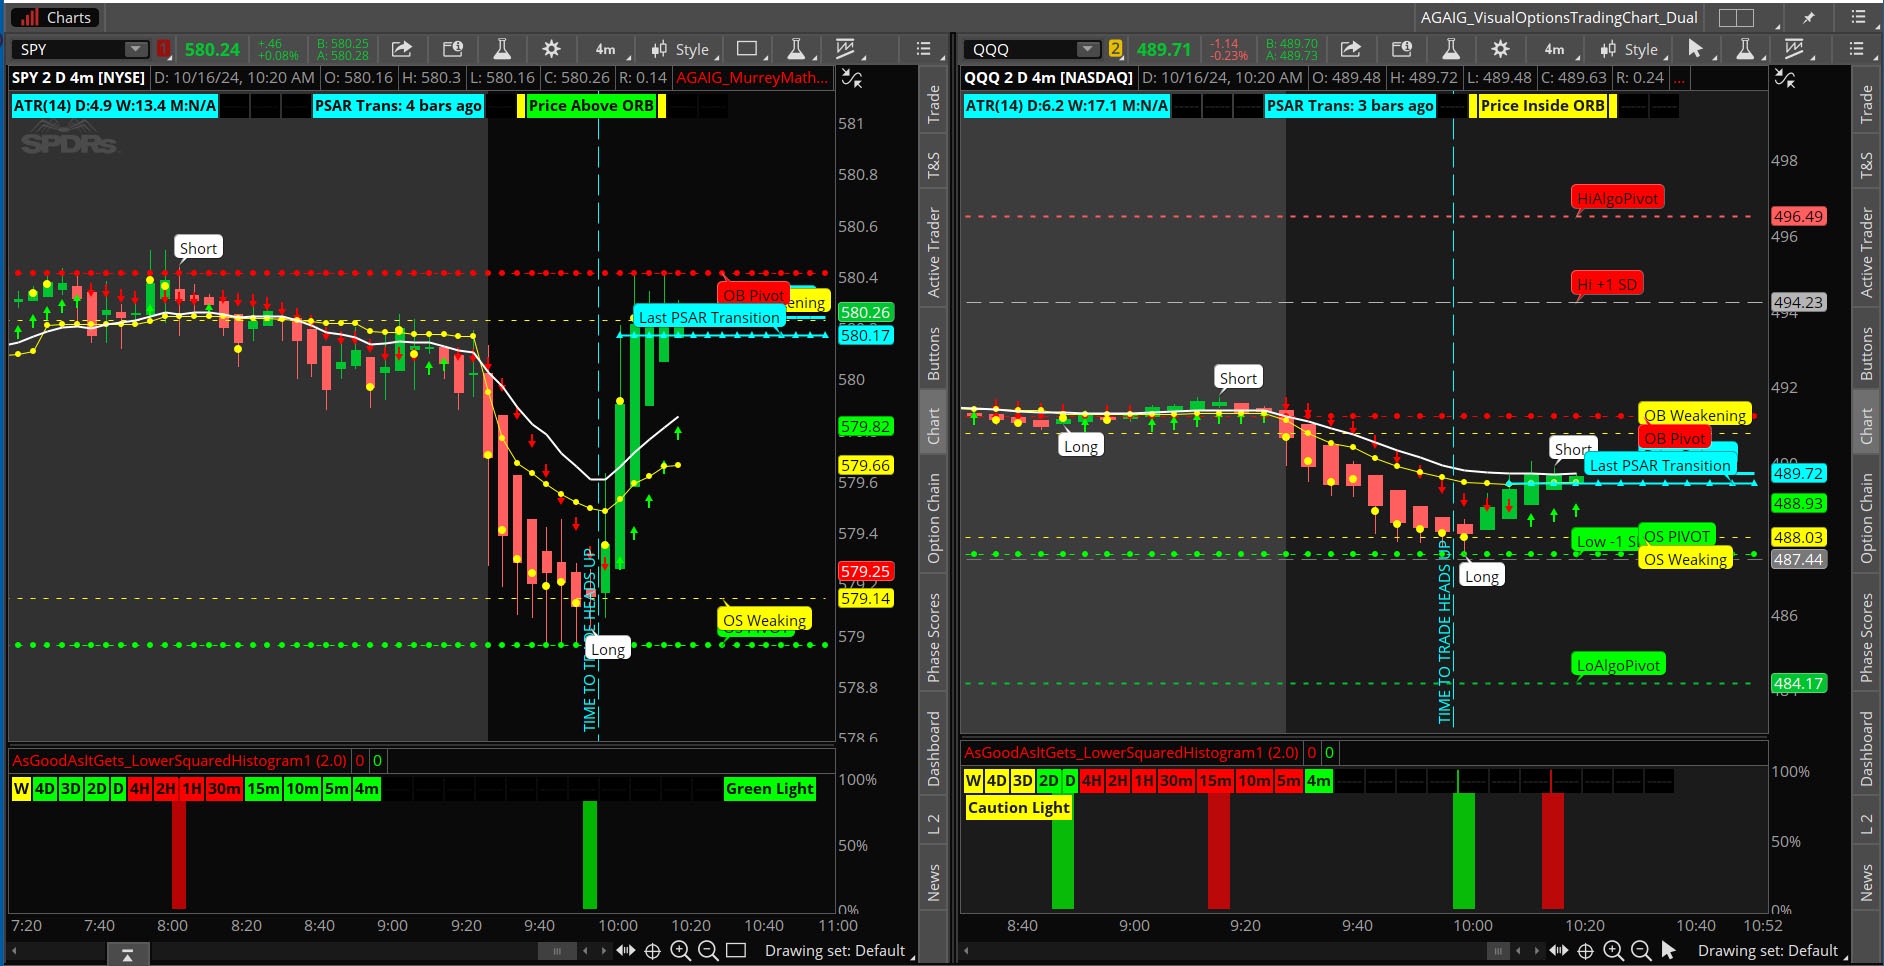
MAJOR KEY POINT: When using my charting similar to the AGAIG Visual Options Trading Chart
https://usethinkscript.com/threads/agaig-visual-options-trading-chart-for-thinkorswim.19840/
I’m using the Long/Short Bubbles and Lower Squared Histograms for entry/exits after looking back 2-3 days to see what the average intraday movement (AIM) has been and use that average for expected intraday movement.

I have found it best for intraday trading:
I quit screening a long time ago since most stocks are basically making the same movements over and over. To me screening is a waste of time especially for intraday trading. I also like to start and end the day with cash positions.
- to only trade the same 2-4 stocks over and over
- using 5-10 days expiration for my intraday trades.
Some approximate Stats using average intraday movements on some of the ones I Day (Scalp) Trade: (2-day intraday average movements) are as follows:
SNOW: 10 Entry/Exit Bubbles with average 5.92 intraday moves including end of day exits. ATM trades = 5.92 X .5 X 100 = $2.96 potential per trade X 3 trades/day = $888 profit daily. I place GTC Exits at .75% of expected move, watch for turning points, and expect profit of approx. $600 - $1,000+ Daily.
VST: 14 Entry/Exit Bubbles including EOD (End of Day) exits with average 2.5 intraday moves. ATM trades = $125 potential on 5 contracts. 3 Trades/day = $375 or more easy profit per day.
The other two I watched on Friday last was AVGO and MSFT.
I’ll let you figure out the intraday averages for your favorite trades. Honesty is a good practice and my goal is $2K+ per day and Friday last easily eclipsed that amount and I was away half the day!!).
My trading setup used to have six (or more) monitors and now only use three monitors (two with double charts with the one in the middle having only the options trading chain. I have two stocks showing that I trade for the day on the right monitor with the other two stocks on the left monitor that might be traded if showing clear entry or exit signals?
My trades are usually just ITM (In-the-Money)so there is a little intrinsic value to start. I trade Friday’s expirations Monday - Wednesday and then the next week's beginning Thursday. Some of my favorite stocks are SNOW, VST, AVGO and MSFT and usually place a GTC of .75 - 1.00 per contract on these. My goal is to be in cash at the beginning of the day and back into cash at end of day although occasionally I will have to hold overnight which leaves me a few days grace if needed.
Bottom line you only need 2-4 stocks for day trading, know the average intraday moves, relax and don’t be greedy. You never lose money when you take a profit. Taking profit on half the expected movement increases the odds greatly.
I know traders who exit trades at 10-12% profit, others at 2-25% profit whereas I’m looking for 50 cents – 1.00 per contract profit. Your risk determines you toleration to profit/loss.
Greed (trading options) is usually inversely proportional to one’s expectations?
My pre-trading (daily) routine: Twenty minutes on our “stationary” bike (approximately 2.5 miles) always wearing a helmet in case I get hit by a stationary car!
Happy day trading!
@csricksdds
Is it possible to get "AsGoodAsItGets_LowerSquaredHistogram1" as a watchlist column code instead of study code?
Last edited by a moderator:
