Repaints AGAIG DayTrading - Scalping For Success In ThinkOrSwim

Repaints
Thanks for your kind words - I was in/out MSFT eight times today. A little profit is always a profit and I’m no prophet!

May I ask how you were in/out of MSFT 8 times (01-24)? Looking at the chart i only see a few entries:

1737774735046.png


Do the Long/Short bubbles repaint often? How about the red light/green light on the lower indicator?
 
Last edited by a moderator:
AGAIG
As Good As It Gets
DAY TRADING – SCALPING FOR SUCCESS​


So, what is the best way to Day Trade? How do I Day Trade? What stocks (ETFs) are picked, and why do I pick them? How do I know when to enter and/or exit?

The old song “knowing when to hold them, knowing when to fold them, knowing when to walk away and knowing when to run” fits well for an options' day trader!

First of all let’s look at what to trade. I quit trading (for the most part) 0DTE (zero days until expiration) although I have done well with these during my foregone more alert days. Sometimes I will trade the ODE SPY, but not as much as I used to. Too many others work better with less stress and give more flexibility?

I want stocks that:
  • move more than five points (ATR) per day (based on a 9 period look back).
  • Entries/Exits will be taken when the “intraday” has moved 1.75 - 2.0 of its daily intraday ATR (Intraday Average True Range).
  • I mostly trade five contracts at a time.
  • This will frequently give me 2-3 trades on the same stock each day.

ATR gives the average movement of the security on a daily, weekly, or monthly basis, but we’re trading intraday and can expect multiple up and down movements within that range during the day with a possible ORB (Opening 15-30 minute Breakout) to the upside or downside.

An added comment if I may: It has been my experience that most stocks close at the edges or within the ORB (15-30 minute Opening Range Breakout). When trading into closing I take this into consideration. I also notice that stocks tend to move towards the VWAP (Volume Weighted Average Price) which to me represents home-base for a security (a frequent area of resistance). I also stated that I trade Friday’s Expirations Monday thru Wednesday and then begin trading the next week out. I actually start the next week out at Wednesday between Noon and 1:00 p.m.


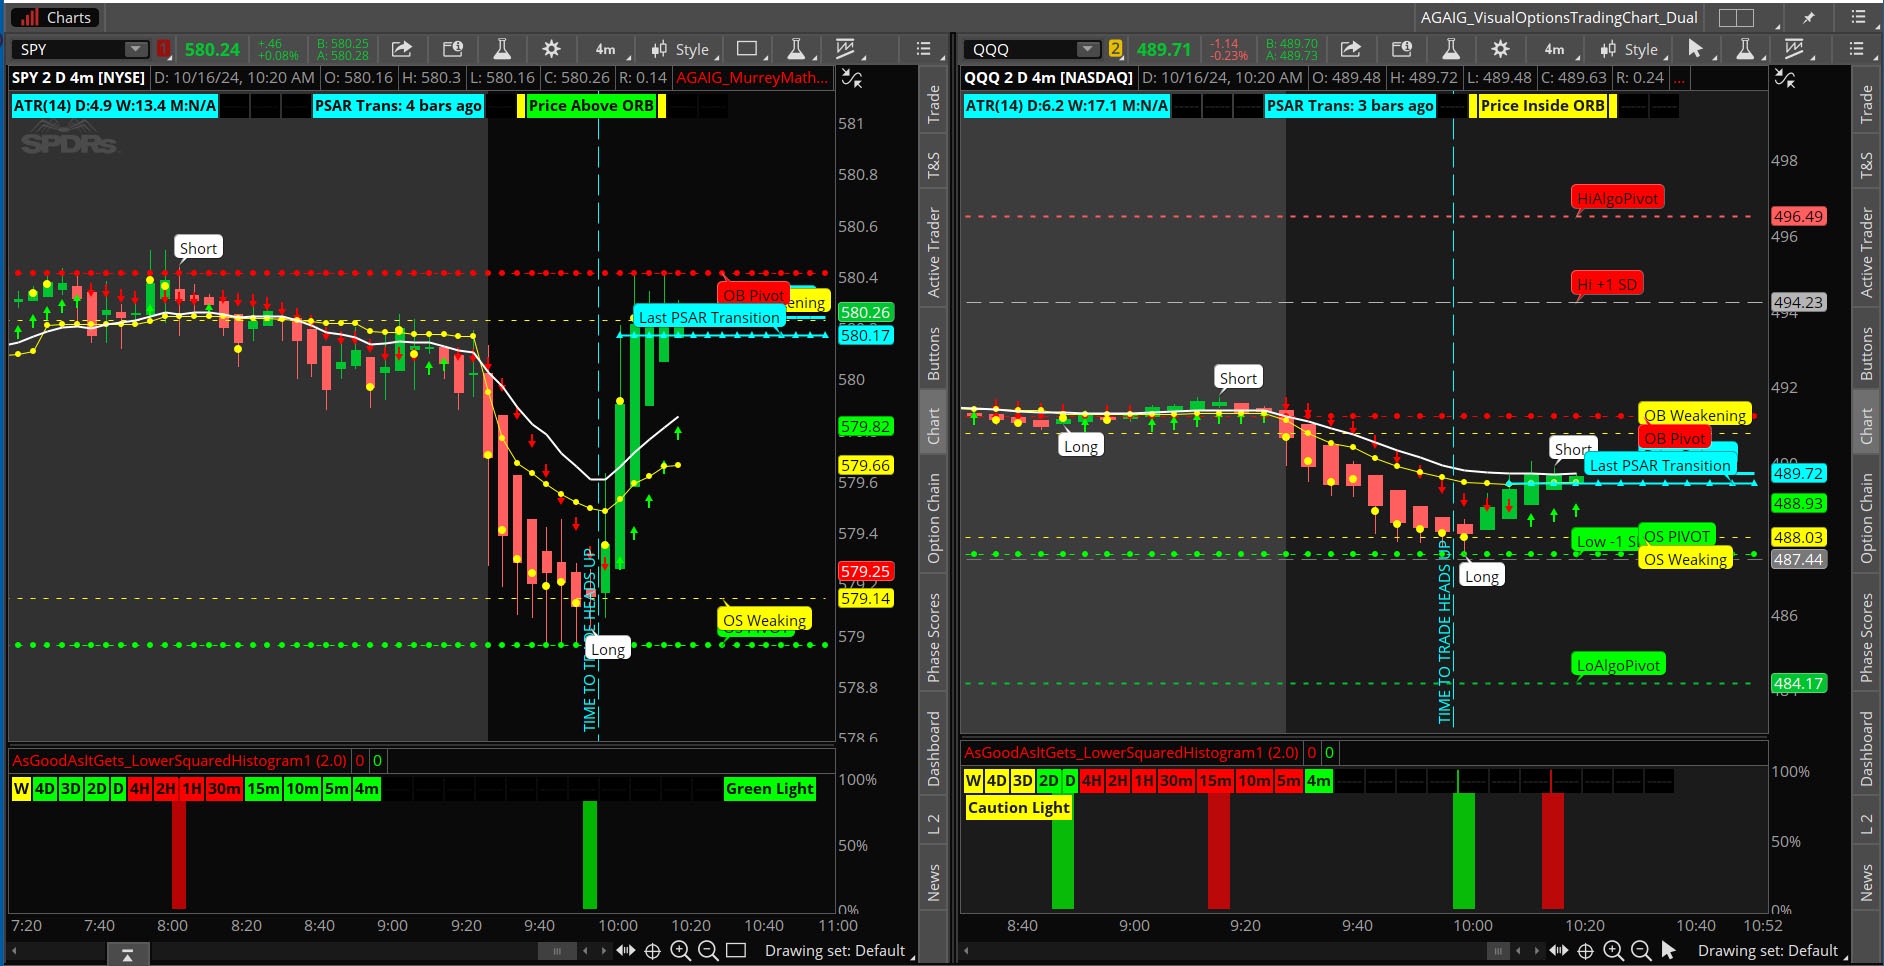
MAJOR KEY POINT: When using my charting similar to the AGAIG Visual Options Trading Chart
https://usethinkscript.com/threads/agaig-visual-options-trading-chart-for-thinkorswim.19840/
I’m using the Long/Short Bubbles and Lower Squared Histograms for entry/exits after looking back 2-3 days to see what the average intraday movement (AIM) has been and use that average for expected intraday movement.

eub0oQY.jpeg


I have found it best for intraday trading:
  • to only trade the same 2-4 stocks over and over
  • using 5-10 days expiration for my intraday trades.
I quit screening a long time ago since most stocks are basically making the same movements over and over. To me screening is a waste of time especially for intraday trading. I also like to start and end the day with cash positions.

Some approximate Stats using average intraday movements on some of the ones I Day (Scalp) Trade: (2-day intraday average movements) are as follows:

SNOW: 10 Entry/Exit Bubbles with average 5.92 intraday moves including end of day exits. ATM trades = 5.92 X .5 X 100 = $2.96 potential per trade X 3 trades/day = $888 profit daily. I place GTC Exits at .75% of expected move, watch for turning points, and expect profit of approx. $600 - $1,000+ Daily.

VST: 14 Entry/Exit Bubbles including EOD (End of Day) exits with average 2.5 intraday moves. ATM trades = $125 potential on 5 contracts. 3 Trades/day = $375 or more easy profit per day.

The other two I watched on Friday last was AVGO and MSFT.

I’ll let you figure out the intraday averages for your favorite trades. Honesty is a good practice and my goal is $2K+ per day and Friday last easily eclipsed that amount and I was away half the day!!).

My trading setup used to have six (or more) monitors and now only use three monitors (two with double charts with the one in the middle having only the options trading chain. I have two stocks showing that I trade for the day on the right monitor with the other two stocks on the left monitor that might be traded if showing clear entry or exit signals?

My trades are usually just ITM (In-the-Money)so there is a little intrinsic value to start. I trade Friday’s expirations Monday - Wednesday and then the next week's beginning Thursday. Some of my favorite stocks are SNOW, VST, AVGO and MSFT and usually place a GTC of .75 - 1.00 per contract on these. My goal is to be in cash at the beginning of the day and back into cash at end of day although occasionally I will have to hold overnight which leaves me a few days grace if needed.

Bottom line you only need 2-4 stocks for day trading, know the average intraday moves, relax and don’t be greedy. You never lose money when you take a profit. Taking profit on half the expected movement increases the odds greatly.

I know traders who exit trades at 10-12% profit, others at 2-25% profit whereas I’m looking for 50 cents – 1.00 per contract profit. Your risk determines you toleration to profit/loss.

Greed (trading options) is usually inversely proportional to one’s expectations?

My pre-trading (daily) routine: Twenty minutes on our “stationary” bike (approximately 2.5 miles) always wearing a helmet in case I get hit by a stationary car!

Happy day trading!
Huge help for me. I am trying to figure which indicator will work best for my day trading strategy, your points make sense! Do not be greedy! Love it. Thank you again.
 
Hello all,

I'm new to Day Trading, in fact haven't really day traded yet. I'm working on creating my setup. Right now I'm thinking the @csricksdds AGAIG set up and using this scanner to finding stocks.
https://usethinkscript.com/threads/identify-the-big-movers.20100/#post-150094
so far,

@jserenson1153
THANK YOU SO MUCH!

As of right now, I'm sorting by the sizzle index. looking for stocks below 2.0 on the sizzle index. Anything above, right now, I'm seeing as too volatility (maybe newbie problem, or my comfort level) for my setup and too inconsistent (As in scanning the price action of the last day/ early day likely not to repeat the next day.) So I'm looking at trading stocks stocks between 2.0 to ~1.4 on the sizzle index.

I'm also liking stocks earnings announcements in the afternoons, but trading the price action as day trader before the earnings announcement. I was looking at SMCI a few days ago, I thought this looked perfect for what I wanted to do using the AGAIG setup.

I currently don't have a coral of stocks for AGAIG. I'm in the process of trying to find stocks to use AGAIG. I'm seeking ways to find good day tradable stocks. Learning curve are not always straight lines, so I guess I need some slack as I learn here. I hope it's ok that I chat with others.

Any thoughts or insights to my current thinking would be helpful.
 
Last edited by a moderator:
@MURFMURF

@jserenson1153's Swing Trade stocks would not be optimum for day trading.
Swingers trade fundamentally strong stocks that have taken a dip, knowing they’ll eventually bounce back. No stress if they drop further; they are positioning for the long-term. Knowing EVENTUALLY the stocks will retrace to higher highs.

Day traders want the opposite. Stocks with strong interday movement.
Focusing on stocks making higher highs and higher lows, riding momentum, and cutting losers fast.
https://usethinkscript.com/threads/the-vip-linear-regression-channel.20522/
sulB25F.png


NEVER EVER trade those basement dwellers.
BAdX5w0.png

The VIP magic scan is used to filter out those stocks:
https://usethinkscript.com/threads/vip-supertrend-trendmagic.20201/


Key to day trading:
  1. Momentum is king – Trade only when the market is moving. https://usethinkscript.com/threads/vip-supertrend-trendmagic.20201/
  2. Small corral of stocks – Not all stocks move enough daily. Pick a few high-ATR plays. https://usethinkscript.com/threads/identify-the-big-movers.20100/#post-150094
  3. Trend matters – Higher highs, higher lows = good. Choppy, sideways action = bad. Basement dwellers = awful!

Hope this helps.
 
Last edited:
Thanks I am mainly interested in Swing Trading.
Getting reccomendations on stocks to buy, or sell.
I am investing more than I did before.
And am trying to decide what is the best way to decide exit strategies.
The recommendation is buy and set a 25% stop to protect your investment and let the winners run raising the stop as it goes up.
But I am looking at the stocks and trying to determine if the recommendation will get to that stop
and try to cul the losses early.
But know enough that the stock will keep rising.
Then exit when it has changed direction, now it is in a downtrend and before was in an uptrend.
 
Thank you for the help (Scanner), sorry for the confusion.

I understand everything you said and why you are saying it.

But I'm still considering going is different direction. (I would also use your method sometimes as well). I was just seeing if anyone would be interested in discussing my idea of how to find more stock like shown here. While I'm still trying to establish what good looks like in day trading. My current method of doing so, I don't think this look too bad. ~13% on one day trade.

mod note:
 

Attachments

  • Day_Trading_Example1.png
    Day_Trading_Example1.png
    258.2 KB · Views: 106
Last edited by a moderator:
@MURFMURF

Please note that your chart image is based on repainted signals.
Repainters pretend to present perfect signals and present those enormous profits.
That is because repainters erase all the false signals that potentially would have wiped out your portfolio.
https://usethinkscript.com/threads/answers-to-commonly-asked-questions.6006/#post-57833


@csricksdds emphasizes that those repainted signals can not be used alone for your entry and exit, as illustrated on your chart.
Here is how @csricksdds recommends to use AGAIG repainters:
https://usethinkscript.com/threads/...ses-repaint-indicators-for-thinkorswim.20126/

Regardless of what strategy, you decide on; it is essential to develop your small corral of instruments which have liquidity and solid ATR movement.


This scan was created based on the characteristics of the stock shown in your chart image.
tNlalx7.png

***These are not the instruments recommended for use with AGAIG charts.
But members have requested this alternative list; so here it is:

You can modify any of the filters.
This scan is designed to create a small corral of stocks.
There is no strategy associated with this scan. There are no buy/sell signals
nkfN8oy.png

This VIP scan link can be found: https://usethinkscript.com/threads/the-vip-linear-regression-channel.20522/#post-150795
 
Last edited by a moderator:
Thank you for the well thought out reply and help.


I think I'm understanding your concerns for using on repaint "That is because repaints erase all the false signals that potentially would have wiped out your portfolio". I do see signal repainting/ changing in live trading.


I'm just working on a theory of different count measures. I'm early in my theory; this is what I have so far.

It's an 80/20 rule, watch live for confirmation. As in, the aim is to be right 80% of the time. And be ready to bail out on the failed signals 20% of the time. This is what I mostly do in swing trading.


Can not solely rely on buy and sell signals from AGIAG indicator. My theory is to use the indicator in live trading with tolerance limit using a 1 minute chart. Each following candle is confirmation to the indicator. NOT if the indicator says buy, just wait for the sell signal (Bad idea). Agreed, this can wipe things out with bad plan.

2) I’m considering other indicators for confirmation, but haven’t decide yet to look for confirmation.

3) This is a bit of a merger of how I enter swing trades.

First entry-very small often (Unless I see a perfect chart setup - rare, I see 1-3 of these a year in swing trading)

4) Then use the next ~2-10 candles for adding to the position as each candle is confirming the signal.

5) In a bull trade, if there is drastic down move before the buy signal, this could create a good bounce of energy in the stock. Perhaps having ~1-5% (blind guess number, no data yet) of lead ball drops. Be ready to get out and move on not sure of the time frame yet, perhaps 5-15 minutes.

6) I’m currently just watching stocks live on the market (Understanding the repaint issue) (no money) to confirm if my theory would work.

7) The screen shot I sent; it watched this stock live as it unfolded. Watching for good and false signals. The theory needs more vetting, as I’ve only done this with 3 stocks so far. But it’s looking good so far.
 
Hello all,

I'm new to Day Trading, in fact haven't really day traded yet. I'm working on creating my setup. Right now I'm thinking the @csricksdds AGAIG set up and using this scanner to finding stocks.
https://usethinkscript.com/threads/identify-the-big-movers.20100/#post-150094
so far,

@jserenson1153
THANK YOU SO MUCH!

As of right now, I'm sorting by the sizzle index. looking for stocks below 2.0 on the sizzle index. Anything above, right now, I'm seeing as too volatility (maybe newbie problem, or my comfort level) for my setup and too inconsistent (As in scanning the price action of the last day/ early day likely not to repeat the next day.) So I'm looking at trading stocks stocks between 2.0 to ~1.4 on the sizzle index.

I'm also liking stocks earnings announcements in the afternoons, but trading the price action as day trader before the earnings announcement. I was looking at SMCI a few days ago, I thought this looked perfect for what I wanted to do using the AGAIG setup.

I currently don't have a coral of stocks for AGAIG. I'm in the process of trying to find stocks to use AGAIG. I'm seeking ways to find good day tradable stocks. Learning curve are not always straight lines, so I guess I need some slack as I learn here. I hope it's ok that I chat with others.

Any thoughts or insights to my current thinking would be helpful.
Stocks basically spend the day doing the same thing up and down. Find one or two with 5+ ATR and close bid/ask and trade them. Screening is a waste of time. I trade the same 2-3 stocks multiple times (at least twice) every day with much less stress. I trade 5-6 contracts on each mostly mornings by 11:30 and sometimes after 2:00?
 
@csricksdds

In the below code, I created a label to flash upon the specified indicator criteria being met. The label appropriately flashes green at the entry candle I am targeting however the red label is not flashing when the same and opposite criteria are met. Can someone help push me in the right direction on what could need to be updated in my code?

Code:
#CSR Buy/Sell Arrows with Short/LongHaulFilter Bubbles
#Developed 4-9-22 First Edition

declare upper;

input atrreversal = 2.0;#Hint atrreversal: Turn down for more entries, up for less entries. Purple signal indicates low point reversal and close approaching Kijun. Orange signal indicates the price is crossing the Kijun. Green signal indicates the low of the candle holds over the Kijun. Red signal means reversal at a high point.  
def priceh = MovingAverage(AverageType.EXPONENTIAL, high, 5);
def pricel = MovingAverage(AverageType.EXPONENTIAL, low, 5);

def EIL = ZigZagHighLow("price h" = priceh, "price l" = pricel, "percentage reversal" = .01, "absolute reversal" = .05, "atr length" = 5, "atr reversal" = atrreversal).lastL;
def EIH = ZigZagHighLow("price h" = priceh, "price l" = pricel, "percentage reversal" = .01, "absolute reversal" = .05, "atr length" = 5, "atr reversal" = atrreversal).lastH;

def tenkan_period = 9;
def kijun_period = 26;
def Kijun = (Highest(high, kijun_period) + Lowest(low, kijun_period)) / 2;
def avgPerc = ((Kijun - close) / Kijun) * 100;

plot signal = !isNaN(EIL) within 15 bars and low < Kijun and avgPerc < 15 and avgPerc > 0 and avgPerc[1] < avgPerc;
signal.setDefaultColor(color.white);

plot KijunCross = signal within 10 bars and Crosses(close, kijun, CrossingDirection.ABOVE);
kijuncross.setDefaultColor(color.white);

def overKijun = (kijunCross within 10 bars or overKijun[1] == 1) and low > kijun;
plot overKijun1 = overKijun;
overKijun1.setDefaultcolor(color.white);

plot signaldown = !isNAN(EIH);
signaldown.SetPaintingStrategy(PaintingStrategy.BOOLEAN_ARROW_down); AddLabel(!isNAN(EIH),"Short",color.white);

AddChartBubble(SignalDown, high, "Short", Color.white, yes);


plot signalrevBot = !isNaN(EIL);

AddChartBubble(Signalrevbot, low, "Long", Color.White, no);
AddLabel(!isNan(EIL), "LONG", Color.GREEN);

input usealerts = yes;
alert(usealerts and signaldown[1] == 1, "Short", alert.bar, sound.ring);
alert(usealerts and signalrevbot[1] == 1, "Long", alert.bar, sound.ring);


##################################
##################################
##################################
##################################

def HAclose = ohlc4;
rec HAopen = CompoundValue(1, (HAopen[1] + HAclose[1]) / 2, HAclose);
def HAhigh = Max(high, Max(HAopen, HAclose));
def HAlow = Min(low, Min(HAopen, HAclose));
def haBuy = HAopen <= HAlow;
def haSell = HAopen >= HAhigh;
rec count = if haBuy == 1 and count[1] == 0 then 1 else if haSell == 0 and count[1] >= 1 then count[1] + 1 else 0;
rec count1 = if haSell == 1 and count1[1] == 0 then 1 else if haBuy == 0 and count1[1] >= 1 then count1[1] + 1 else 0;
def PrimaryUP = if HAopen <= HAlow and haBuy == 1 and count[1] == 0 then yes else no;
def PrimaryDOWN = if HAopen >= HAhigh and haSell == 1 and count1[1] == 0 then yes else no;

plot ArrowUp = if PrimaryUP then HAlow else Double.NaN;
ArrowUp.SetDefaultColor(Color.DARK_ORANGE);
ArrowUp.SetPaintingStrategy(PaintingStrategy.BOOLEAN_ARROW_UP);
ArrowUp.SetLineWeight(5);
ArrowUp.HideBubble();

plot ArrowDown = if PrimaryDOWN then HAhigh else Double.NaN;
ArrowDown.SetDefaultColor(Color.DARK_ORANGE);
ArrowDown.SetPaintingStrategy(PaintingStrategy.BOOLEAN_ARROW_DOWN);
ArrowDown.SetLineWeight(5);
ArrowDown.HideBubble();

# Entry conditions
def long_entry = signalrevBot[1] and ArrowUp;  # Previous candle had no bottom wick
def short_entry = signaldown[1] and ArrowDown;     # Previous candle had no top wick

# Strategy orders
AddOrder(OrderType.BUY_AUTO, long_entry, tickcolor = Color.WHITE, name = "Long Open");
AddOrder(OrderType.SELL_AUTO, short_entry, tickcolor = Color.WHITE, name = "Short Open");

DefineGlobalColor("     Go Long     ", color.green);
DefineGlobalColor("     Go Short     ", color.red);
DefineGlobalColor("     No Entry     ", color.Yellow);

AddLabel(Yes, "     Entry/Exit     ", if long_entry[1] then GlobalColor("     Go Long     ") else if short_entry[1] then GlobalColor("     Go Short     ") else GlobalColor("     No Entry     "));
 
Last edited by a moderator:
@csricksdds, Hi, Is it possible to get AGAIG MurreyMathPivot lines in premarket? I see those appear in day trade hours only. Can you please help?

@csricksdds , for example META, pivot lines doesn't show up in pre market, but as soon as market opens, pivot lines along with level zero and 1 appears from 12 am CST.
 

Attachments

  • Screenshot 2025-02-19 085910.jpg
    Screenshot 2025-02-19 085910.jpg
    41.1 KB · Views: 26
  • Screenshot 2025-02-19 090753.jpg
    Screenshot 2025-02-19 090753.jpg
    109.6 KB · Views: 29

Join useThinkScript to post your question to a community of 21,000+ developers and traders.

Similar threads

Not the exact question you're looking for?

Start a new thread and receive assistance from our community.

87k+ Posts
493 Online
Create Post

Similar threads

Similar threads

The Market Trading Game Changer

Join 2,500+ subscribers inside the useThinkScript VIP Membership Club
  • Exclusive indicators
  • Proven strategies & setups
  • Private Discord community
  • ‘Buy The Dip’ signal alerts
  • Exclusive members-only content
  • Add-ons and resources
  • 1 full year of unlimited support

Frequently Asked Questions

What is useThinkScript?

useThinkScript is the #1 community of stock market investors using indicators and other tools to power their trading strategies. Traders of all skill levels use our forums to learn about scripting and indicators, help each other, and discover new ways to gain an edge in the markets.

How do I get started?

We get it. Our forum can be intimidating, if not overwhelming. With thousands of topics, tens of thousands of posts, our community has created an incredibly deep knowledge base for stock traders. No one can ever exhaust every resource provided on our site.

If you are new, or just looking for guidance, here are some helpful links to get you started.

What are the benefits of VIP Membership?
VIP members get exclusive access to these proven and tested premium indicators: Buy the Dip, Advanced Market Moves 2.0, Take Profit, and Volatility Trading Range. In addition, VIP members get access to over 50 VIP-only custom indicators, add-ons, and strategies, private VIP-only forums, private Discord channel to discuss trades and strategies in real-time, customer support, trade alerts, and much more. Learn all about VIP membership here.
How can I access the premium indicators?
To access the premium indicators, which are plug and play ready, sign up for VIP membership here.
Back
Top