Hi Team,
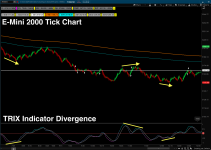
Is it possible to plot lines on the TRIX indicator provided by TOS that shows divergence based on price action and TRIX momentum?
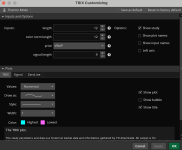
The current settings I am using for this indicator on a 2000 tick chart are:
Length: 12
Price: VWAP
Signal Length: 9
#
# TD Ameritrade IP Company, Inc. (c) 2007-2024
#
declare lower;
input length = 12;
input colorNormLength = 12;
input price = VWAP;
input signalLength = 9;
def tr = ExpAverage(ExpAverage(ExpAverage(Log(price), length), length), length);
plot TRIX = (tr - tr[1]) * 10000;
plot Signal = ExpAverage(TRIX, signalLength);
plot ZeroLine = 0;
TRIX.DefineColor("Highest", Color.YELLOW);
TRIX.DefineColor("Lowest", Color.LIGHT_RED);
TRIX.AssignNormGradientColor(colorNormLength, TRIX.color("Lowest"), TRIX.color("Highest"));
Signal.setDefaultColor(GetColor(3));
ZeroLine.SetDefaultColor(GetColor(5));
Please see the attached for your reference. I have provided a chart that shows an example for divergence scenarios and the type of plot for divergence needed.
Is it possible to plot lines on the TRIX indicator provided by TOS that shows divergence based on price action and TRIX momentum?
The current settings I am using for this indicator on a 2000 tick chart are:
Length: 12
Price: VWAP
Signal Length: 9
#
# TD Ameritrade IP Company, Inc. (c) 2007-2024
#
declare lower;
input length = 12;
input colorNormLength = 12;
input price = VWAP;
input signalLength = 9;
def tr = ExpAverage(ExpAverage(ExpAverage(Log(price), length), length), length);
plot TRIX = (tr - tr[1]) * 10000;
plot Signal = ExpAverage(TRIX, signalLength);
plot ZeroLine = 0;
TRIX.DefineColor("Highest", Color.YELLOW);
TRIX.DefineColor("Lowest", Color.LIGHT_RED);
TRIX.AssignNormGradientColor(colorNormLength, TRIX.color("Lowest"), TRIX.color("Highest"));
Signal.setDefaultColor(GetColor(3));
ZeroLine.SetDefaultColor(GetColor(5));
Please see the attached for your reference. I have provided a chart that shows an example for divergence scenarios and the type of plot for divergence needed.