
Here is an Adaptive StochasticFull indicator. It is tuned to the market dominant cycle using the band-pass filter method as described in chapter 5 of Dr Ehlers' "Cycle analytics for Traders". The data is smoothed using the EhlersSuperSmootherFilter before it is fed into the indicator to reduce chatter. The smoothing length is set to the dominant cycle length as well. It is shown below as the indicator in the middle of the screenshot, just above the volume indicator. The length of the yellow FullD line can be set using the properties dialog.

Here is the script for the Adaptive StochasticFull indicator:
Enjoy!
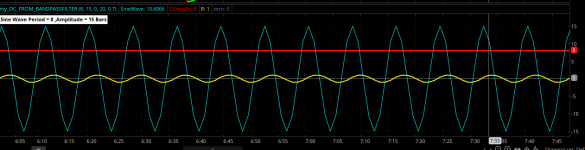
Here are test results made where the band-pass filter method as used to determine the dominant cycle of sine waves each having different periods across a wide range of values. In all, the band-pass filter gets a good value for the dominant cycle but the method could be improved by counting the number of candles across the whole cycle. Currently it only counts the candles that occur in half the cycle then multiplies by two to get the dominant cycle period. As a result, when the period turns out to be an odd number the value this method gets will be an even number and will be off by +/-1 for a sinewave. Here are the results:

The red line is the Dominant Cycle length measured by the zero crossings of the band-pass filter. Zero crossings of the yellow line are watched and the number of candles between crossings are counted and multiplied by two to get the measured value of the dominant cycle length. The yellow line was made by the band-pass filter. The Cyan line is the SineWave signal of given period length = 8. As shown in the screenshot, the band-pass filter measured the period length correctly getting DC = 8.
Here are two more test cases showing the band-pass filter method gets the correct DC length for a sinewave having period = 20 and period = 40:


Because the band-pass filter method is only counting one half of the cycle then multiplying by two, it does not get the correct DC length when the sinewave has a period length that is odd. However, the values that it gets are only off by +/- 1 as shown in the test cases below:
For sinewave period = 7, the band-pass filter gets DC = 6 or DC = 8, with the correct number being the average of the two:

For sinewave period = 19, band-pass filter measures DC = 20 or DC = 18 with the correct value being the average of the two:

And finally for sinewave DC = 39, the band-pass filter measures DC = 40 or DC = 38, with the correct value being the average of the two:

So you can see that for a sinewave, the band-pass filter method gets precise results and those results can be improved Furthermore, the band-pass method performs well in ThinkOrSwim and does not bog the computer down. Enjoy!
Here is the script for the Adaptive StochasticFull indicator:
CSS:
# Adaptive StochasticFull Using Dominant Cycle via Bandpass Filter Method by Sesqui 18OCT2025
# Uses BandPass Filter method from ch 5 of Dr Ehlers, "Cycle Analyticsfor Traders"
# to tune the StochasticFull indicator to the Market Dominant Cycle

# Adaptive StochasticFull Using Dominant Cycle via Bandpass Filter Method

declare lower;
input ShowFullD = yes;
input ShowHMA = no;
input BandPassSource = ohlc4;
input BandPassPeriod = 20;
input BandPassBandwidth = 0.70;

###------------------------------------------------------------------------------------------
input OpenTime = 845;   #hint OpenTime: Time you want backtesting to start the session at
input CloseTime = 1600;  #hint CloseTime: Time you want backtesting to stop the session at

def Begin = SecondsFromTime(OpenTime) ;
def End = SecondsTillTime(CloseTime);
# Only use market hours when using intraday timeframe
def isIntraDay = if GetAggregationPeriod() > 14400000 or GetAggregationPeriod() == 0 then 0 else 1;
def MarketOpen = if !isIntraDay then 1 else if isIntraDay and  Begin >= 0 and End >= 0 then 1 else 0;
###--------------------------------------------------------------------------------------------------


#===================================================================================
#*** Script to measure dominant cycle length using band-pass
#*** filter zero crossings method per Dr Ehlers
#*** Chapter 5 of "Cycle Analytics for Traders".
script GetCycleViaBandPassFilter {
    input source = ohlc4;
    input Period = 20;
    input Bandwidth = 0.70;

    def cosPart = Cos(0.25 * Bandwidth * 2.0 * Double.Pi / Period);
    def sinPart = Sin(0.25 * Bandwidth * 2.0 * Double.Pi / Period);

    def alpha2 = (cosPart + sinPart - 1) / cosPart;
    def HP = (1 + alpha2 / 2) * (source - source[1]) + (1 - alpha2) * HP[1];

    def beta1 = Cos(2.0 * Double.Pi / Period);
    def gamma1 = 1 / Cos(2.0 * Double.Pi * Bandwidth / Period);

    def alpha1 = gamma1 - Sqrt(gamma1 * gamma1 - 1);

    def BP = if BarNumber() == 1 or BarNumber() == 2 then 0 else 0.5 * (1 - alpha1) * (HP - HP[2]) + beta1 * (1 + alpha1) * BP[1] - alpha1 * BP[2];

    def Peak = if AbsValue(BP) > 0.991 * Peak[1] then AbsValue(BP) else 0.991 * Peak[1];

    def Real = if Peak <> 0 then BP / Peak else Double.NaN;

    def crossAbove = Real crosses above 0;
    def crossBelow = Real crosses below 0;
    def zeroCrossing = crossAbove or crossBelow;

    # Uses a recursive variable to count the bars between zero-crossings
    # If a zero-crossing happens, resets the count to 0.
    # Otherwise, increments the count by 1.
    def barsSinceCross = if zeroCrossing then 0 else barsSinceCross[1] + 1;
    def barsBetweenCrossings = barsSinceCross + 1;
    def val = if barsBetweenCrossings < barsBetweenCrossings[1] then 2 * barsBetweenCrossings[1] else val[1];

    # The following line is a port of Dr Ehlers EasyLanguage program, kept here for reference
    #def DC = If barsBetweenCrossings < 3 then 3 else If 2*(barsBetweenCrossings) > 1.25*DC[1] then 1.25*DC[1] else if 2*(barsBetweenCrossings) < 0.8*DC[1] then 0.8*DC[1] else DC[1];

    plot DC = val;
    DC.HideBubble();

} # End script GetCycleViaBandPassFilter{}
#=============================================================================
#--------------
script get_Highest {
    input source = high;
    input CycleLength = 10;

    def length = if IsNaN(Floor(CycleLength)) then length[1] else Floor(CycleLength);
    def cur = source[0];
    def val = fold i = 0 to length with max = cur do if max >= GetValue(source, i + 1) then max else GetValue(source, i + 1);
    plot Highest = val;
    Highest.HideBubble();
}# end Script getHighest{}

#--------------
script get_Lowest {
    input source = low;
    input CycleLength = 10;

    def length = if IsNaN(Floor(CycleLength)) then length[1] else Floor(CycleLength);
    def cur = source[0];
    def val = fold i = 0 to length with min = cur do if min <= GetValue(source, i + 1) then min else GetValue(source, i + 1);
    plot Lowest = val;
    Lowest.HideBubble();
}# end Script getLowest{}
#------------------------------------------------------------------------------
Script AdaptSMA{
    input source = close;
    input CycleLength = 10;

    def length = if IsNaN(Floor(CycleLength)) then length[1] else Floor(CycleLength);
    def sum = fold index = 0 to Length with s = 0 do s + GetValue(source,index);
    plot SMA = sum / CycleLength;
    SMA.HideBubble();
}# End Script AdaptSMA{}
#-------------------------------------------------------------------------------
Script SmoothTheSignal{
    # EhlersSuperSmootherFilter{}
    input price = close;
    input Length = 10;

    def CutOffLength = if IsNaN(Floor(Length)) then CutOffLength[1] else Floor(Length);
    def a1 = Exp(-Double.Pi * Sqrt(2) / cutoffLength);
    def coeff2 = If CutOffLength <> 0 then 2 * a1 * Cos(Sqrt(2) * Double.Pi / cutoffLength) else 0;
    def coeff3 = - Sqr(a1);
    def coeff1 = 1 - coeff2 - coeff3;
    def filt = if IsNaN(price + price[1]) then filt[1] else coeff1 * (price + price[1]) / 2 + coeff2 * filt[1] + coeff3 * filt[2];

    plot Smoothed = if !IsNaN(price) then filt else Double.NaN;
    Smoothed.HideBubble();
} #End Script SmoothTheSignal{}
#==============================================================================================
# StochasticFull
#========================================================================================

input over_bought = 80;
input over_sold = 20;
input H = high;
input L = low;
input C = close;
input slowing_period = 3;

input showBreakoutSignals = {default "No", "On FullK", "On FullD", "On FullK & FullD"};

def Cycle = GetCycleViaBandPassFilter(BandPassSource, BandPassPeriod, BandPassBandwidth).DC;
def CycleLength = if IsNaN(Floor(Cycle)) then CycleLength[1] else Floor(Cycle);
def KPeriod = CycleLength;
input DPeriod = 9;

def priceH = SmoothTheSignal(H,CycleLength);
def priceL = SmoothTheSignal(L,CycleLength);
def priceC = SmoothTheSignal(C,CycleLength);

def lowest_k = get_Lowest(priceL,CycleLength);
def c1 = priceC - lowest_k;
def c2 = get_Highest(priceH, KPeriod) - lowest_k;
def FastK = if c2 != 0 then c1 / c2 * 100 else 0;

plot FullK = If MarketOpen then AdaptSMA(FastK, slowing_period) else Double.NaN;
plot FullD = if MarketOpen and ShowFullD then AdaptSMA(FullK, DPeriod) else Double.NaN;
FullD.AssignValueColor(Color.YELLOW);
FullD.SetLineWeight(2);

# *** Displays an HMA(34) for cross overs ***
input HMALength = 34;

plot HMA = If MarketOpen and ShowHMA then MovingAverage(AverageType.HULL, FullK, HMALength) else Double.NaN;
HMA.AssignValueColor(Color.YELLOW);
HMA.SetLineWeight(2);

plot OverBought = If MarketOpen then over_bought else Double.NaN;
plot OverSold = If MarketOpen then over_sold else Double.NaN;

FullK.SetDefaultColor(Color.CYAN);
FullD.SetDefaultColor(Color.YELLOW);
FullK.AssignValueColor(if FullK-FullK[1] >= 0 then Color.Green else Color.RED);
FullK.SetLineWeight(3);
FullD.SetlineWeight(2);

def Diff = FullK - FullK[1];
FullK.DefineColor("Positive and Up", Color.GREEN);
FullK.DefineColor("Positive and Down", Color.DARK_GREEN);
FullK.DefineColor("Negative and Down", Color.RED);
FullK.DefineColor("Negative and Up", Color.DARK_RED);
FullK.AssignValueColor(if Diff >= 0 then if Diff > Diff[1] then FullK.color("Positive and Up") else FullK.color("Positive and Down") else if Diff < Diff[1] then FullK.color("Negative and Down") else FullK.color("Negative and Up"));

def top = 100;
def bottom = 0;

OverBought.SetStyle(Curve.SHORT_DASH);
OverBought.SetDefaultColor(Color.Red);

OverSold.SetStyle(Curve.SHORT_DASH);
OverSold.SetDefaultColor(Color.Green);

addCloud(top,OverBought, Color.LIGHT_RED, Color.Current);
addCloud(OverSold,bottom, Color.LIGHT_GREEN, Color.Current);

plot center = If MarketOpen then 50 else Double.NaN;
center.SetStyle(Curve.SHORT_DASH);
center.AssignValueColor(Color.Gray);
Enjoy!
Here are test results made where the band-pass filter method as used to determine the dominant cycle of sine waves each having different periods across a wide range of values. In all, the band-pass filter gets a good value for the dominant cycle but the method could be improved by counting the number of candles across the whole cycle. Currently it only counts the candles that occur in half the cycle then multiplies by two to get the dominant cycle period. As a result, when the period turns out to be an odd number the value this method gets will be an even number and will be off by +/-1 for a sinewave. Here are the results:
The red line is the Dominant Cycle length measured by the zero crossings of the band-pass filter. Zero crossings of the yellow line are watched and the number of candles between crossings are counted and multiplied by two to get the measured value of the dominant cycle length. The yellow line was made by the band-pass filter. The Cyan line is the SineWave signal of given period length = 8. As shown in the screenshot, the band-pass filter measured the period length correctly getting DC = 8.
Here are two more test cases showing the band-pass filter method gets the correct DC length for a sinewave having period = 20 and period = 40:
Because the band-pass filter method is only counting one half of the cycle then multiplying by two, it does not get the correct DC length when the sinewave has a period length that is odd. However, the values that it gets are only off by +/- 1 as shown in the test cases below:
For sinewave period = 7, the band-pass filter gets DC = 6 or DC = 8, with the correct number being the average of the two:
For sinewave period = 19, band-pass filter measures DC = 20 or DC = 18 with the correct value being the average of the two:
And finally for sinewave DC = 39, the band-pass filter measures DC = 40 or DC = 38, with the correct value being the average of the two:
So you can see that for a sinewave, the band-pass filter method gets precise results and those results can be improved Furthermore, the band-pass method performs well in ThinkOrSwim and does not bog the computer down. Enjoy!
Attachments
Last edited: