# macd_histo_colors_arrows_strat
#https://usethinkscript.com/threads/accessing-items-in-macd-diff.17075/
#Accessing items in MACD.Diff
#Peppermshrimp 11/2
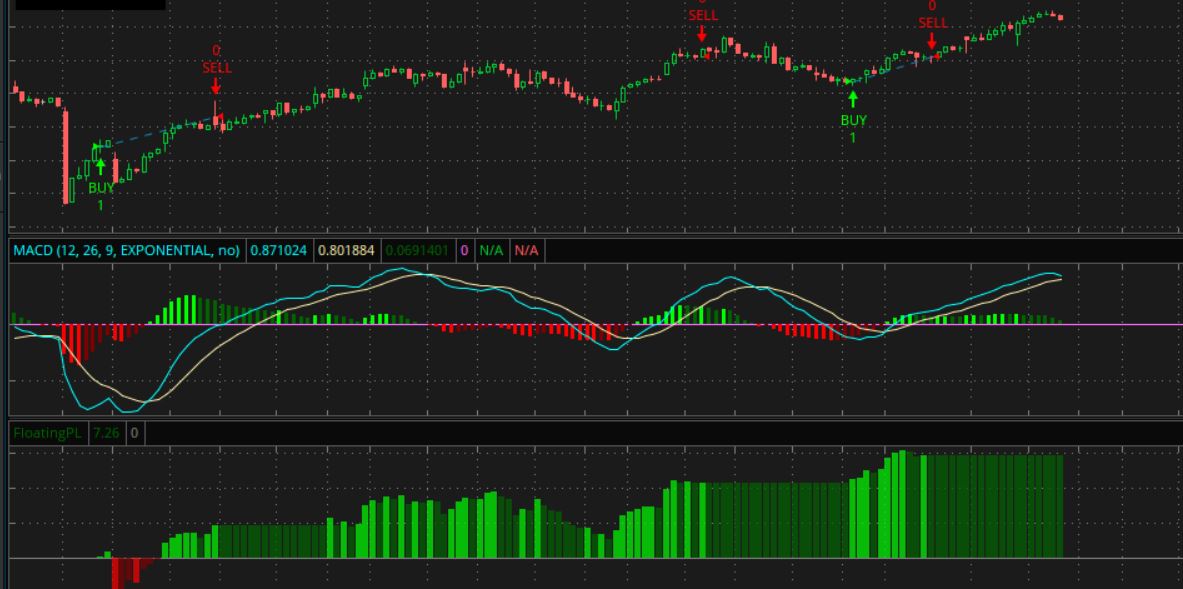
#Is there a way to reference 4 different ‘trends’ in MACD.Diff, other than just to change the colors? I am referring to ‘Negative and Down’, ‘Negative and Up’, ‘Positive and Down’, and ‘Positive and Up’. (see images below) I would like to set up a Strategy that puts an up arrow on the chart when these switch between ‘Negative and Down’ to ‘Negative and Up’, and puts a down arrow on the chart when they switch from ‘Positive and Down’ to ‘Positive and Up’. The only thinkscript I can find with respect to these 4 trends is when the color is being defined.
def na = double.nan;
def bn = barnumber();
def ref1 = if bn == 1 then close else ref1[1];
# macd
# TD Ameritrade IP Company, Inc. (c) 2007-2023
input fastLength = 12;
input slowLength = 26;
input MACDLength = 9;
input averageType = AverageType.EXPONENTIAL;
input showBreakoutSignals = no;
def Value = MovingAverage(averageType, close, fastLength) - MovingAverage(averageType, close, slowLength);
def Avg = MovingAverage(averageType, Value, MACDLength);
def Diff = Value - Avg;
# create # 's for diff colors , -2 to 2
# all color transistitions
#def Diff_color_num =
# if Diff > 0 and Diff > Diff[1] then 2
# else if Diff < 0 and Diff < Diff[1] then -2
# else if Diff > 0 and Diff < Diff[1] then -1
# else if Diff < 0 and Diff > Diff[1] then 1
# else 0;
# color changes, lowest and highest
def Diff_color_num =
if Diff > 0 and Diff < Diff[1] then -1
else if Diff < 0 and Diff > Diff[1] then 1
else 0;
# require x colors in a row to be considered a new color
input consecutive_bars = 2;
def qty = consecutive_bars;
def numsum = if Sum(Diff_color_num, qty) == (Diff_color_num * qty) then 1 else 0;
def new_color = if (numsum and getvalue(diff_color_num, qty) != diff_color_num) then 1 else 0;
#def new_color = if (numsum and getvalue(numsum, qty) and getvalue(diff_color_num, qty) != diff_color_num) then 1 else 0;
# create a trade signal , from the 1st of consequetive signals
def trade = if bn == 1 then 0
else if Diff_color_num == -1 and new_color then -1
else if Diff_color_num == 1 and new_color then 1
else trade[1];
def buy = (trade[0] == 1 and trade[1] == -1);
def sell = (trade[0] == -1 and trade[1] == 1);
input order_size = 1;
AddOrder(OrderType.BUY_TO_OPEN, buy, open[-1], order_size, Color.GREEN, Color.GREEN, name = "BUY");
AddOrder(OrderType.SELL_TO_CLOSE, sell, open[-1], order_size, Color.RED, Color.RED, name = "SELL");
# AddOrder ( type, condition, price, tradeSize, tickColor, arrowColor, name);
#------------------------------------------
input test1_bubbles = no;
AddChartBubble(test1_bubbles, low*0.996,
diff_color_num + "\n" +
new_color
, Color.YELLOW, no);
input test2_trade = no;
def y = 1;
plot z1 = if test2_trade then ref1 + (trade*y) else na;
input test3_signals = no;
plot up = if test3_signals and new_color and Diff_color_num > 0 then low*0.999 else na;
up.SetPaintingStrategy(PaintingStrategy.ARROW_UP);
#up.SetDefaultColor(Color.green);
up.AssignValueColor(if Diff_color_num == 1 then color.green else if Diff_color_num == 2 then color.dark_green else color.black);
up.setlineweight(3);
up.hidebubble();
plot dwn = if test3_signals and new_color and Diff_color_num < 0 then high*1.001 else na;
dwn.SetPaintingStrategy(PaintingStrategy.ARROW_DOWN);
#dwn.SetDefaultColor(Color.red);
dwn.AssignValueColor(if Diff_color_num == -1 then color.red else if Diff_color_num == -2 then color.dark_red else color.black);
dwn.setlineweight(3);
dwn.hidebubble();
#plot zValue = value;
#plot zAvg = avg;
#plot zDiff = diff;
#plot ZeroLine = 0;
#plot UpSignal = if Diff crosses above ZeroLine then ZeroLine else Double.NaN;
#plot DownSignal = if Diff crosses below ZeroLine then ZeroLine else Double.NaN;
#UpSignal.SetHiding(!showBreakoutSignals);
#DownSignal.SetHiding(!showBreakoutSignals);
#Value.SetDefaultColor(GetColor(1));
#Avg.SetDefaultColor(GetColor(8));
#Diff.SetDefaultColor(GetColor(5));
#Diff.SetPaintingStrategy(PaintingStrategy.HISTOGRAM);
#Diff.SetLineWeight(3);
#Diff.DefineColor("Positive and Up", Color.GREEN);
#Diff.DefineColor("Positive and Down", Color.DARK_GREEN);
#Diff.DefineColor("Negative and Down", Color.RED);
#Diff.DefineColor("Negative and Up", Color.DARK_RED);
#Diff.AssignValueColor(if Diff >= 0 then if Diff > Diff[1] then Diff.Color("Positive and Up") else Diff.Color("Positive and Down") else if Diff < Diff[1] then Diff.Color("Negative and Down") else Diff.Color("Negative and Up"));
#ZeroLine.SetDefaultColor(GetColor(0));
#UpSignal.SetDefaultColor(Color.UPTICK);
#UpSignal.SetPaintingStrategy(PaintingStrategy.ARROW_UP);
#DownSignal.SetDefaultColor(Color.DOWNTICK);
#DownSignal.SetPaintingStrategy(PaintingStrategy.ARROW_DOWN);
#