3 Days Momentum Reversal Scanner for ThinkorSwim

BenTen

Administrative
Staff member
Staff
VIP
Lifetime
This scanner allows you to scan for potential stocks with momentum gathering to the downside and upside in ThinkorSwim. I also turned these scanners into an indicator that plot up and down arrows on your chart.
  • Bullish signal = 3 days up in price and volume
  • Bullish reversal = 3 days down in price, 3 days down in volume
  • Bearish reversal = 3 days down in price, 3 days up in volume

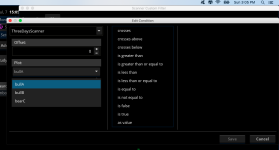
Import the code below as a Study. Switch over to the StockHacker tab and look up its name. Scan for bullA, bullB, and/or bearC.

navYURy.png


thinkScript Code

Code:
# Original code found at https://github.com/hwrdprkns/ThinkOrSwim/blob/master/StockHackerSCAN.ts
# Modified by BenTen to plot arrows on chart

# A. 3 DAYS UP, PRICE AND VOLUME (BULLISH)
def bullishA = (CLOSE > CLOSE[1] AND
CLOSE [1] > CLOSE [2] AND VOLUMEAVG(LENGTH = 20) > VOLUMEAVG(LENGTH = 20)[1] AND VOLUMEAVG(LENGTH = 20)[1] > VOLUMEAVG(LENGTH = 20)[2]);
plot bullA = bullishA;
bullA.AssignValueColor(Color.WHITE);
bullA.SetPaintingStrategy(PaintingStrategy.BOOLEAN_ARROW_UP);

# B. 3 DAYS DOWN IN PRICE, 3 DAYS DOWN IN VOLUME (BULLISH REVERSAL)
def bullishB = (CLOSE < CLOSE[1] AND
CLOSE [1] < CLOSE [2] AND
VOLUMEAVG(LENGTH = 20) > VOLUMEAVG(LENGTH = 20)[1] AND
VOLUMEAVG(LENGTH = 20)[1] > VOLUMEAVG(LENGTH = 20)[2]);
plot bullB = bullishB;
bullB.AssignValueColor(Color.CYAN);
bullB.SetPaintingStrategy(PaintingStrategy.BOOLEAN_ARROW_UP);

# C. 3 DAYS DOWN IN PRICE, 3 DAYS UP IN VOLUME (BEARISH REVERSAL)
def bearishC = (CLOSE < CLOSE[1] AND
CLOSE [1] < CLOSE [2] AND
VOLUMEAVG(LENGTH = 20) > VOLUMEAVG(LENGTH = 20)[1] AND
VOLUMEAVG(LENGTH = 20)[1] > VOLUMEAVG(LENGTH = 20)[2]);
plot bearC = bearishC;
bearC.AssignValueColor(Color.YELLOW);
bearC.SetPaintingStrategy(PaintingStrategy.BOOLEAN_ARROW_DOWN);

Shareable Link

https://tos.mx/h98C8Z
 

Attachments

  • navYURy.png
    navYURy.png
    93.8 KB · Views: 155

Join useThinkScript to post your question to a community of 21,000+ developers and traders.

Hi Ben Thanks for sharing. Just to share, pls select the condition " as value" so that it can be saved as your defined scan name.
 

Similar threads

Not the exact question you're looking for?

Start a new thread and receive assistance from our community.

87k+ Posts
438 Online
Create Post

Similar threads

Similar threads

The Market Trading Game Changer

Join 2,500+ subscribers inside the useThinkScript VIP Membership Club
  • Exclusive indicators
  • Proven strategies & setups
  • Private Discord community
  • ‘Buy The Dip’ signal alerts
  • Exclusive members-only content
  • Add-ons and resources
  • 1 full year of unlimited support

Frequently Asked Questions

What is useThinkScript?

useThinkScript is the #1 community of stock market investors using indicators and other tools to power their trading strategies. Traders of all skill levels use our forums to learn about scripting and indicators, help each other, and discover new ways to gain an edge in the markets.

How do I get started?

We get it. Our forum can be intimidating, if not overwhelming. With thousands of topics, tens of thousands of posts, our community has created an incredibly deep knowledge base for stock traders. No one can ever exhaust every resource provided on our site.

If you are new, or just looking for guidance, here are some helpful links to get you started.

What are the benefits of VIP Membership?
VIP members get exclusive access to these proven and tested premium indicators: Buy the Dip, Advanced Market Moves 2.0, Take Profit, and Volatility Trading Range. In addition, VIP members get access to over 50 VIP-only custom indicators, add-ons, and strategies, private VIP-only forums, private Discord channel to discuss trades and strategies in real-time, customer support, trade alerts, and much more. Learn all about VIP membership here.
How can I access the premium indicators?
To access the premium indicators, which are plug and play ready, sign up for VIP membership here.
Back
Top