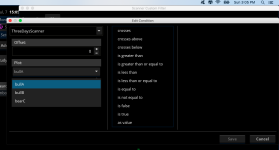
This scanner allows you to scan for potential stocks with momentum gathering to the downside and upside in ThinkorSwim. I also turned these scanners into an indicator that plot up and down arrows on your chart.
Import the code below as a Study. Switch over to the StockHacker tab and look up its name. Scan for bullA, bullB, and/or bearC.

- Bullish signal = 3 days up in price and volume
- Bullish reversal = 3 days down in price, 3 days down in volume
- Bearish reversal = 3 days down in price, 3 days up in volume
Import the code below as a Study. Switch over to the StockHacker tab and look up its name. Scan for bullA, bullB, and/or bearC.
thinkScript Code
Code:
# Original code found at https://github.com/hwrdprkns/ThinkOrSwim/blob/master/StockHackerSCAN.ts
# Modified by BenTen to plot arrows on chart

# A. 3 DAYS UP, PRICE AND VOLUME (BULLISH)
def bullishA = (CLOSE > CLOSE[1] AND
CLOSE [1] > CLOSE [2] AND VOLUMEAVG(LENGTH = 20) > VOLUMEAVG(LENGTH = 20)[1] AND VOLUMEAVG(LENGTH = 20)[1] > VOLUMEAVG(LENGTH = 20)[2]);
plot bullA = bullishA;
bullA.AssignValueColor(Color.WHITE);
bullA.SetPaintingStrategy(PaintingStrategy.BOOLEAN_ARROW_UP);

# B. 3 DAYS DOWN IN PRICE, 3 DAYS DOWN IN VOLUME (BULLISH REVERSAL)
def bullishB = (CLOSE < CLOSE[1] AND
CLOSE [1] < CLOSE [2] AND
VOLUMEAVG(LENGTH = 20) > VOLUMEAVG(LENGTH = 20)[1] AND
VOLUMEAVG(LENGTH = 20)[1] > VOLUMEAVG(LENGTH = 20)[2]);
plot bullB = bullishB;
bullB.AssignValueColor(Color.CYAN);
bullB.SetPaintingStrategy(PaintingStrategy.BOOLEAN_ARROW_UP);

# C. 3 DAYS DOWN IN PRICE, 3 DAYS UP IN VOLUME (BEARISH REVERSAL)
def bearishC = (CLOSE < CLOSE[1] AND
CLOSE [1] < CLOSE [2] AND
VOLUMEAVG(LENGTH = 20) > VOLUMEAVG(LENGTH = 20)[1] AND
VOLUMEAVG(LENGTH = 20)[1] > VOLUMEAVG(LENGTH = 20)[2]);
plot bearC = bearishC;
bearC.AssignValueColor(Color.YELLOW);
bearC.SetPaintingStrategy(PaintingStrategy.BOOLEAN_ARROW_DOWN);
