



Scroll down to check out this week's must reads, carefully selected by uTS Moderators!

Soliton Wave Momentum
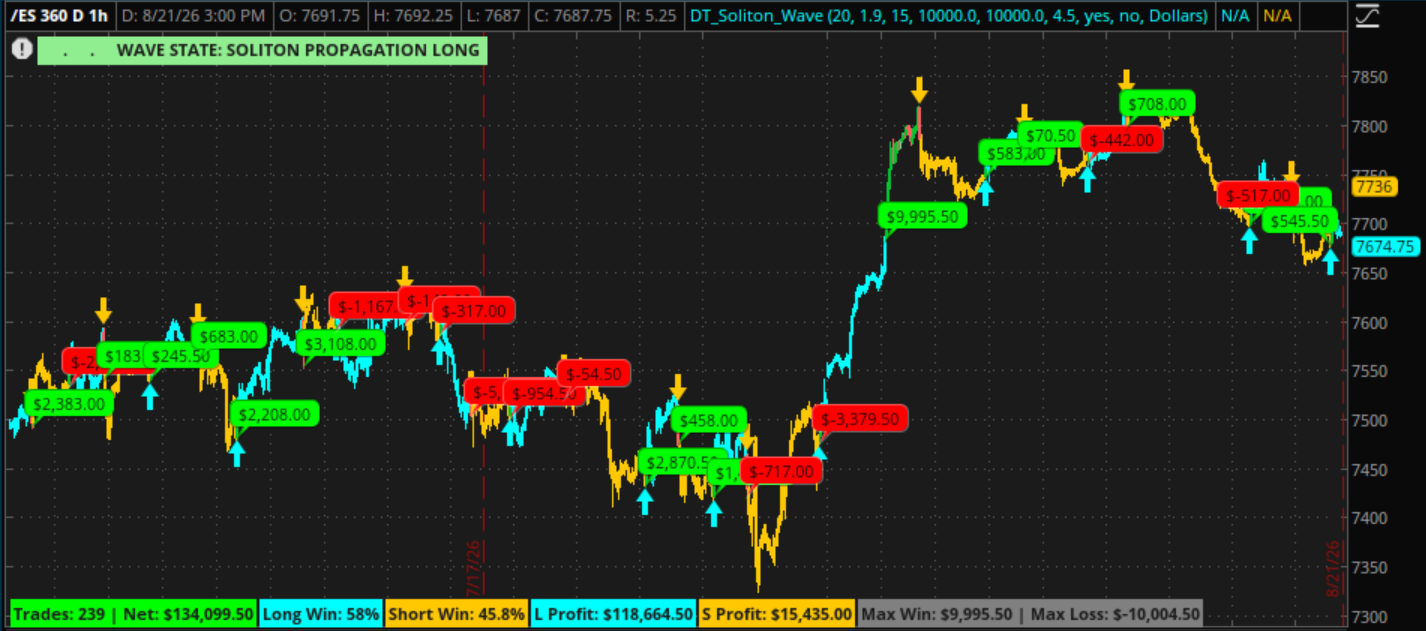
whoDAT said:The Soliton Wave Non-Linear Momentum Engine translates non-linear wave mechanics—originally developed to model solitary waves in hydrodynamics and plasma physics—into a quantitative regime-detection framework for financial markets.
By evaluating market momentum through the Korteweg–de Vries (KdV) differential framework, the study separates ordinary, self-dissipating noise from rare, high-conviction institutional sweeps. Applied to the E-mini S&P 500 (/ES) on a 1-Hour chart, the model isolates structural directional expansion, allowing traders to enter early in momentum pulses that resist immediate mean-reversion.
Read more:
https://usethinkscript.com/threads/soliton-wave-momentum-for-thinkorswim.22647/
Nadaraya-Watson Trend
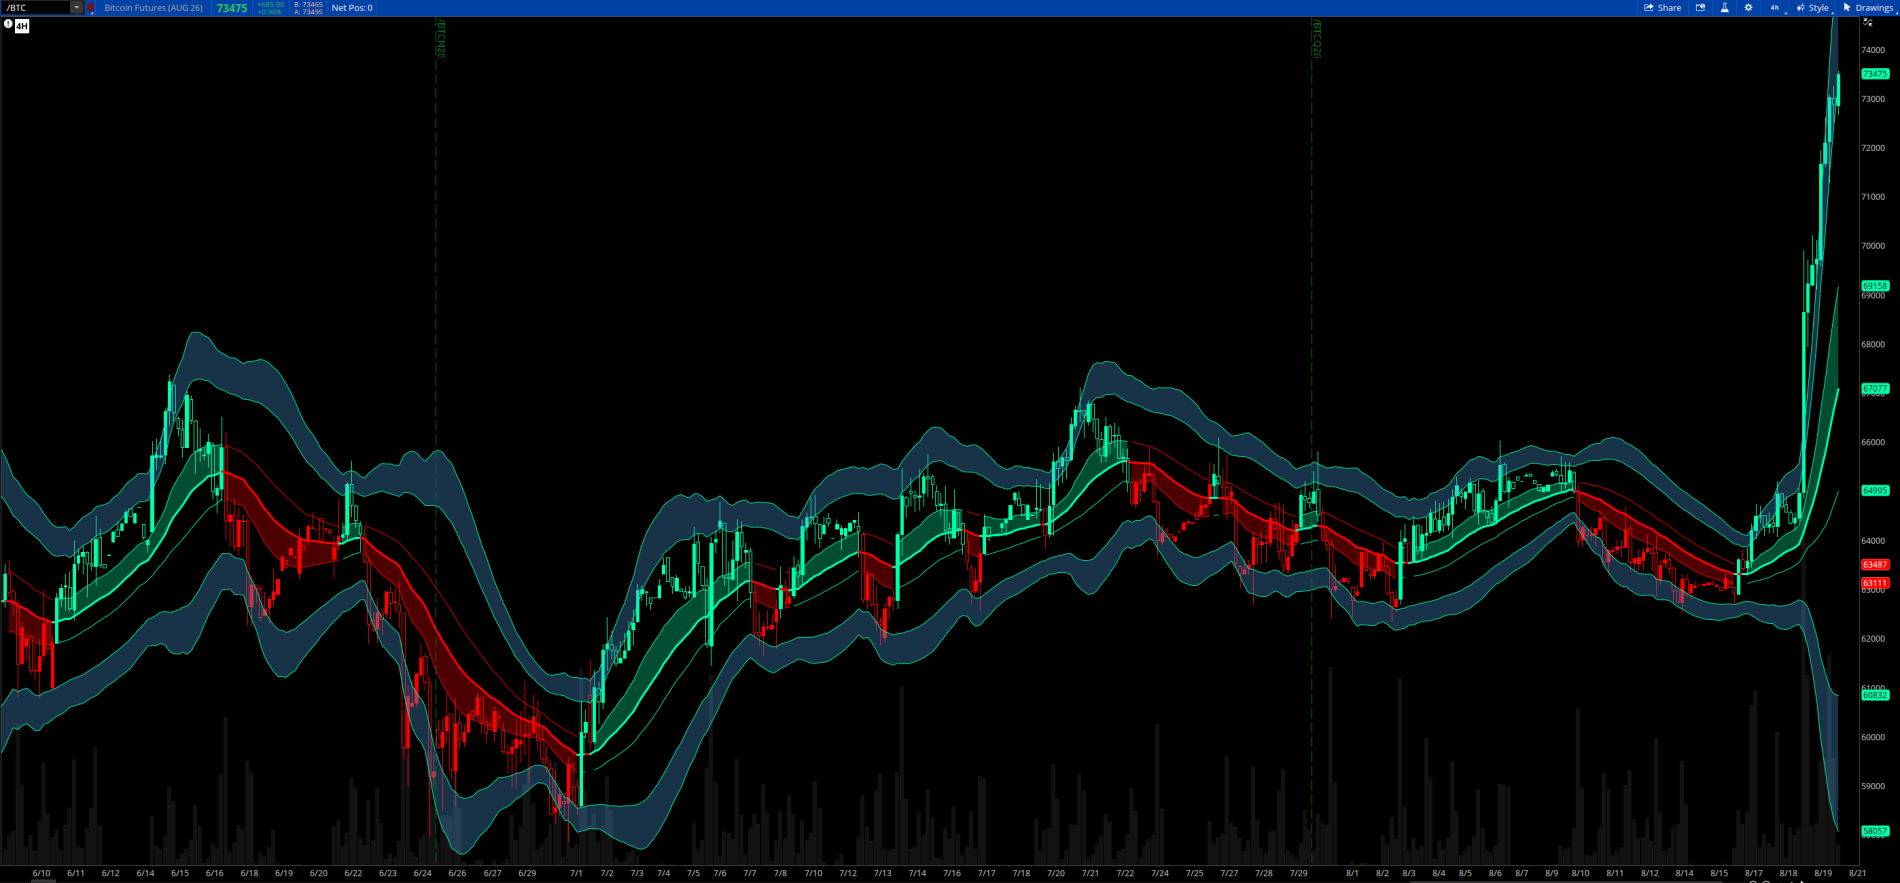
chewie76 said:The Nadaraya-Watson Trend indicator is a non-repainting, causal kernel regression indicator that plots a smoothed trend line with optional bands.
Read more:
https://usethinkscript.com/threads/nadaraya-watson-trend-quantalgo-for-thinkorswim.22645/
VIP SUBSCRIBERS ONLY |
Stock Profiles Based On Float and Institutional Interest
merryDay said:Why You Need a Stock Profile, Not a Holy Grail Scanner
The stocks you trade are like a dating profile—you’re looking for core characteristics that fit your specific style.
A common mistake among novice traders is building quant scanners—filtering on intraday lows, sudden momentum, or moving average crosses. That’s like building a dating profile based purely on surface looks rather than core compatibility.
Professional day and swing traders filter for stock mechanics first.
By isolating key criteria—Float, Institutional Holding, Market Cap, and Volume—you create a corral of instruments naturally built to move the way your strategy requires.
The profile examples below illustrate how to build a stock corral based on different trading styles such as...
Unlock Thread
Read more
https://usethinkscript.com/threads/stock-profiles-based-on-float-and-institutional-interest.22681/

Join our VIP Members Club to get access to our premium indicators including Buy The Dip, Advanced Market Moves and Take Profit.
Your VIP membership includes:
✓Full access to public & private forums
✓No Ads
✓Priority community support
✓Unlimited Postings
✓Premium thinkorswim indicators
✓Exclusive strategies, scanners, add-ons
✓Discord chatroom with Trade Alerts
VIP Membership
Options Ranking Indicators w/ IV Rank, IV percentile, Metrics
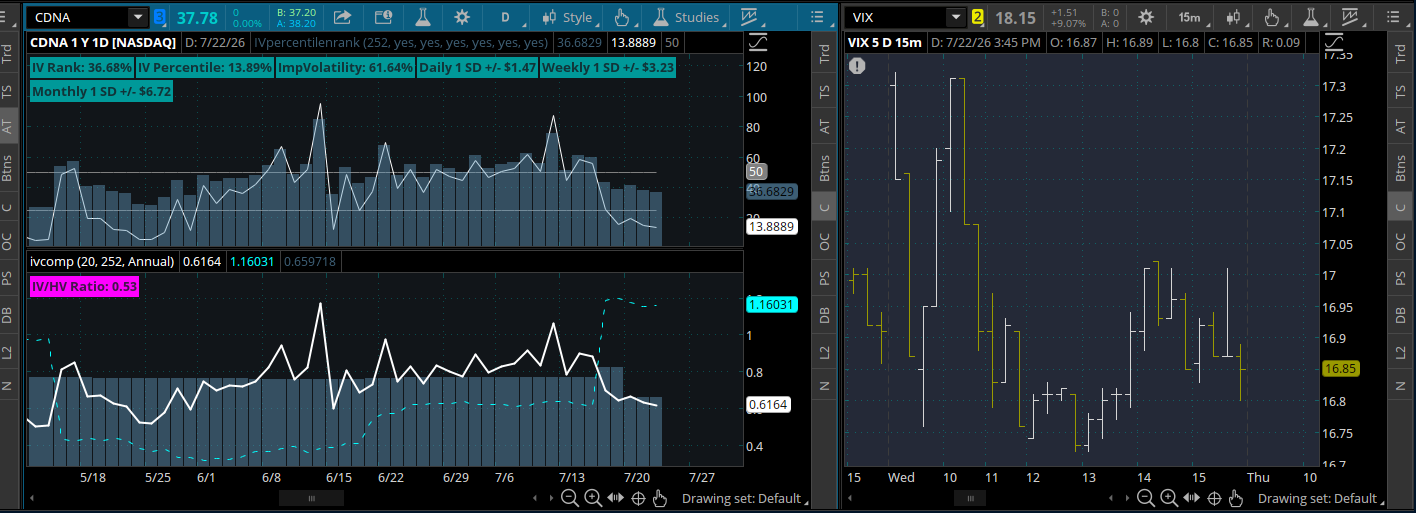
AaronPol shared:Nothing revolutionary. Just the typical options ranking metrics styled in an easier to interpret way. This has served me well by sneaking it in a split screen with Active trader.
Read more:
https://usethinkscript.com/threads/...-iv-percentile-metrics-for-thinkorswim.22579/
FROM THE ARCHIVES |
CSA Trading Dashboard
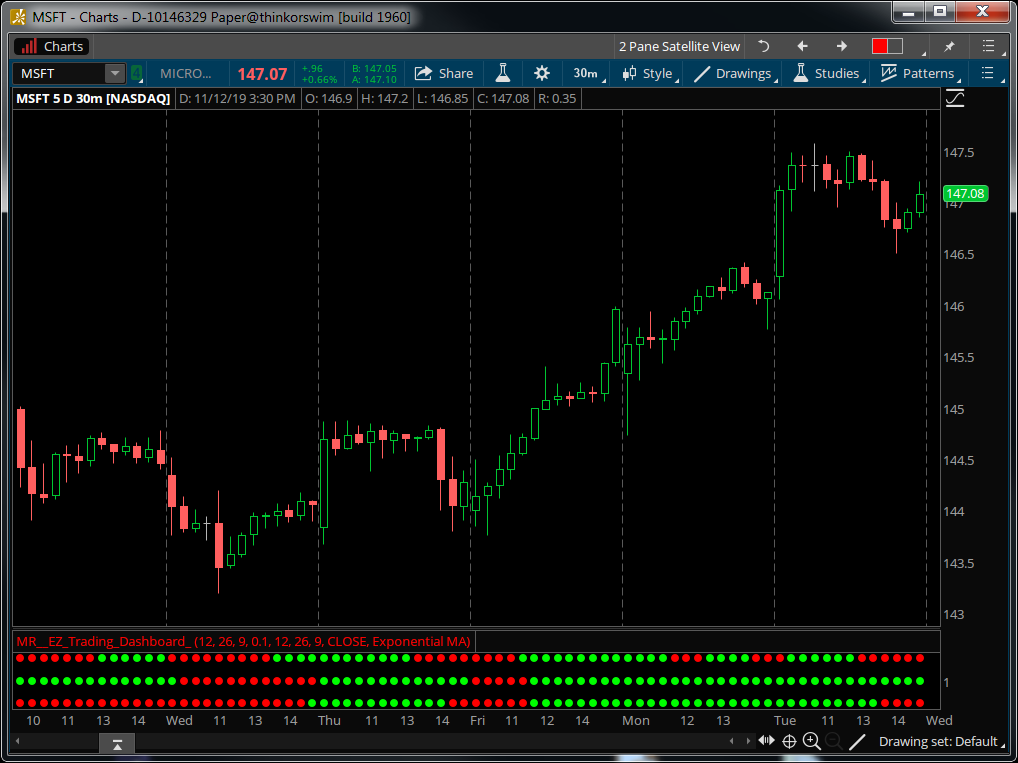
netarchitech shared:Provides vital information without screen clutter. Standard lower charts get chaotic with 5 separate indicators overlaying each other.
Look For Trend Alignment
When most of lines 1 through 5 align in Bright Green, it indicates a high-probability bullish regime
HOW TO TRADE: Focus exclusively on pullbacks to key market structure levels (VWAP, previous day high/low, EMA ribbons).
Look For Early Exhaustion Detection
Because Dark Green signals positive value with decreasing momentum, a sudden transition from bright green to dark green across lines 2 (Stoch) and 5 (Universal Osc) alerts you to momentum decay before price breaks
HOW TO TRADE: Use this signal to trim position size or tighten trailing stops into resistance, rather than waiting for an actual trend reversal.
Read more
https://usethinkscript.com/threads/csa-trading-dashboard-for-thinkorswim.1047/
Last edited by a moderator:

