



Scroll down to check out this week's must reads, carefully selected by uTS Moderators!

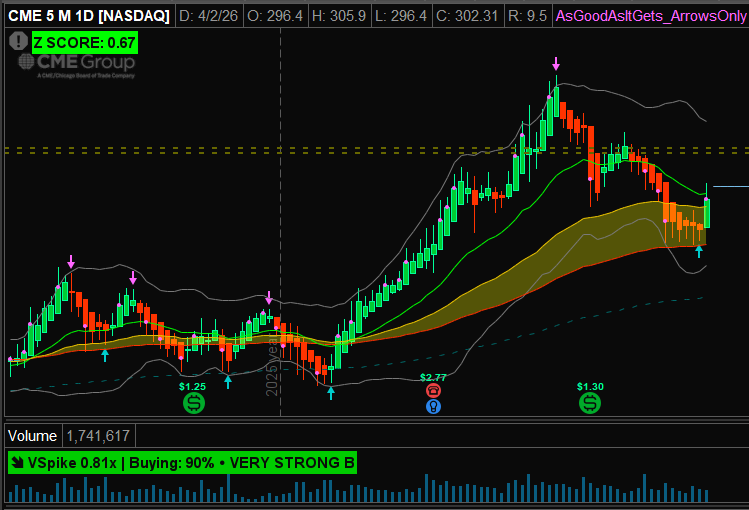
Heiken Ashi Reversals WatchList for Swing Trading
Aktion said:This visual decision accelerator turns raw Heikin‑Ashi into a dashboard. Color‑coding momentum, reversals, and flips into an instant read.
Green signals strength, red signals weakness, bright colors flag change, and darker tones mark conviction. It compresses the entire state of the tape into a glance and tells the eye where to look first during fast markets.
Read more
https://usethinkscript.com/threads/...hlist-for-swing-trading-in-thinkorswim.22297/
Fast Tape V6
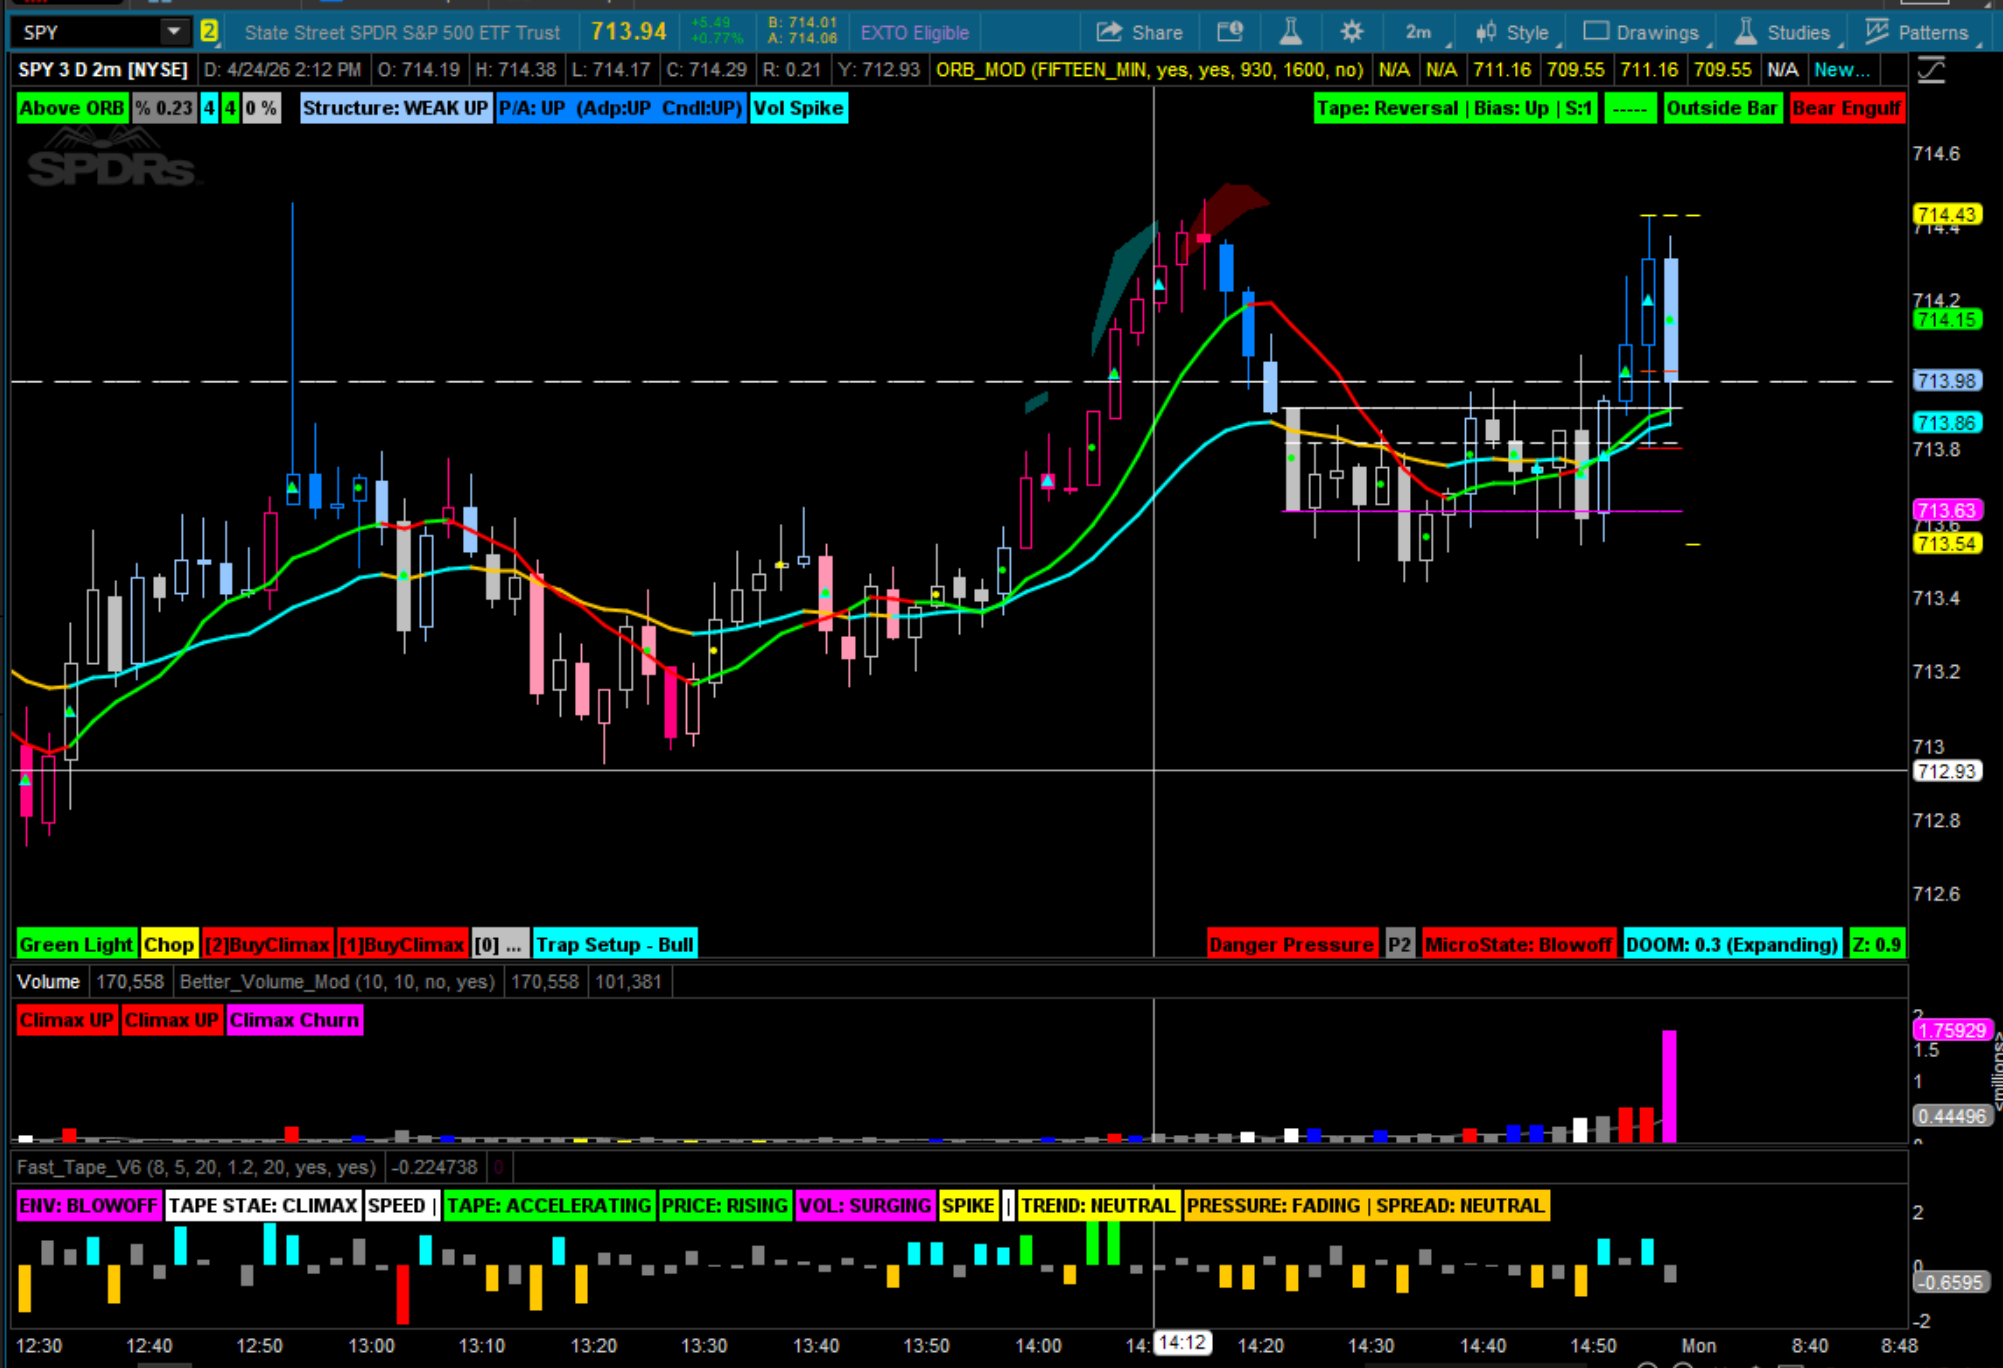
atcsam said:The old ticker tape printed trades on a strip of paper. Traders watched it like pilots listening to engine noise, trying to tell whether the market was accelerating or stalling. Fast forward. We’re not reading paper anymore — we’re reading volatility normalized microstructure. No guessing. Just measurement. Fast Tape acts as a flight data recorder for intraday volatility. It tracks:
• tape speed
• price velocity
• volume acceleration
• pressure slope
• spread behavior
Read more
https://usethinkscript.com/threads/fast-tape-v6-for-thinkorswim.22376/
VIP SUBSCRIBERS ONLY |
Ehlers CyclePeriod - CISD Projections
ᚱ ᛁ ᚢ ᛅ ᚱ ᛏ ᛁ ᛅ ᛋ said:I’ve been working on something for Forex where I can implement the Ehlers period and Fibonacci levels. This combo was created based on LuxAlgo’s new free indicator, which I find very useful. Hope you do as well.
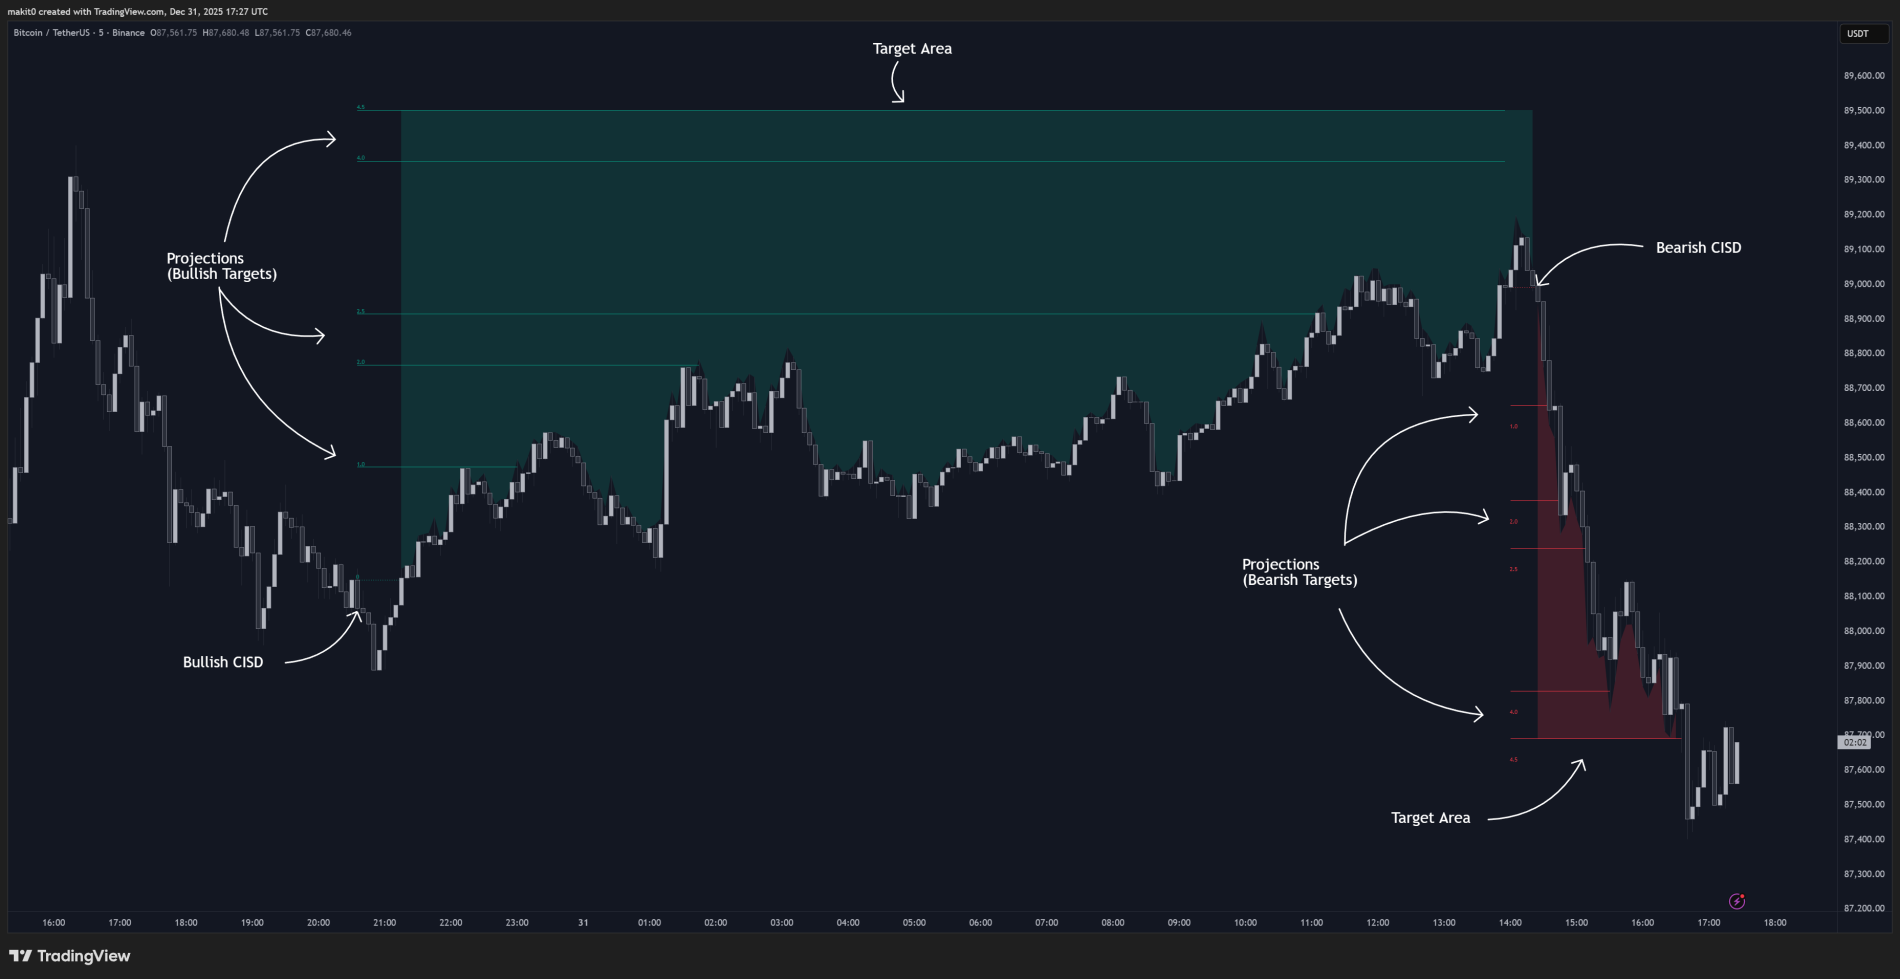
The CISD Projections trading indicator is a mechanical, rules-based tool designed to plot objective price targets after a confirmed market reversal. Built around fractal market structure and manipulation leg analysis, this trading indicator helps traders anticipate where price is statistically most likely to expand next. Instead of relying on subjective take-profit levels, CISD Projections delivers clear, repeatable targets that adapt to volatility, leg size, and current market conditions, making it a powerful addition to any trading strategy.
By combining Change in State of Delivery (CISD) logic with extended Fibonacci projections, this indicator translates market structure into actionable price objectives. It is suitable for discretionary traders seeking confirmation and for systematic traders looking for consistent, mechanical target generation across any market or timeframe.
Read more
https://usethinkscript.com/threads/ehlers-cycleperiod-cisd-projections.22057/
Join our VIP Members Club to get access to our premium indicators including Buy The Dip, Advanced Market Moves and Take Profit.
Your VIP membership includes:
✓Full access to public & private forums
✓No Ads
✓Priority community support
✓Unlimited Postings
✓Premium thinkorswim indicators
✓Exclusive strategies, scanners, add-ons
✓Discord chatroom with Trade Alerts
VIP Membership
AdaptiveTrend v13 – Plus
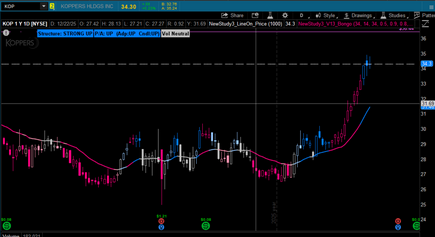
atcsam shared:A structural trend study using two lenses — Structure and Price Action — to give a clear, honest view of the trend.
Adaptive Trend V13 – Plus is built around a simple idea:
price action can lie; structure cannot. Viewing both Structure and Price Action is an Eye Opener for me.
When they agree, the trend is clean. When they diverge, the chart reveals what I usually miss — strength inside weakness, weakness inside strength, and the transitions in between.
Read more
https://usethinkscript.com/threads/adaptivetrend-v13-–-plus-for-thinkorswim.22152/
FROM THE ARCHIVES |
Yield Curve Chart Indicator
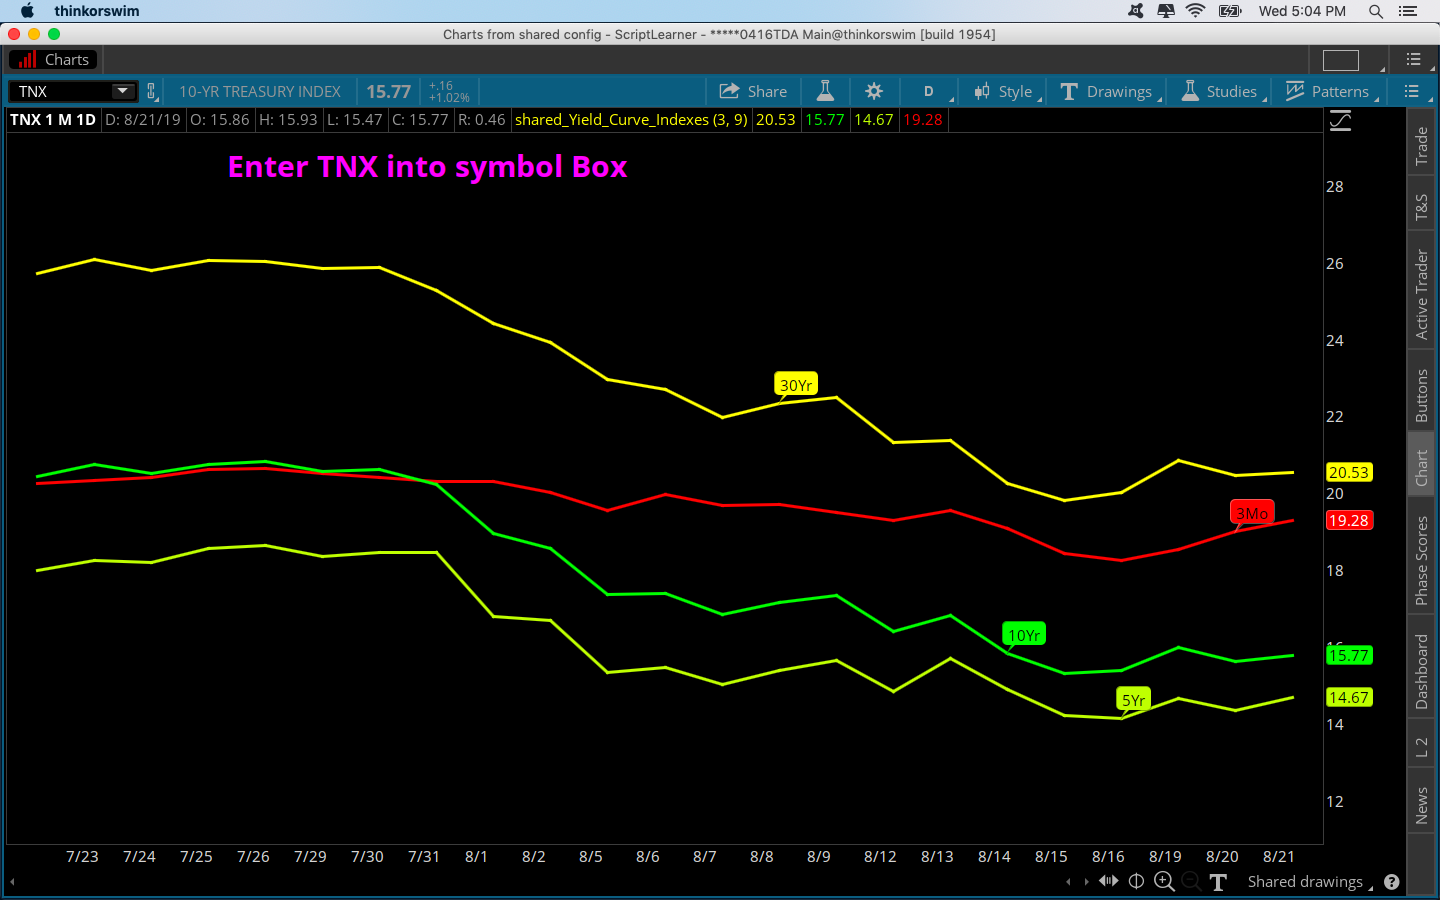
BenTen shared:This script gives you a clean, at‑a‑glance read of the yield curve by plotting the 30‑yr, 10‑yr, 5‑yr, and 3‑month rates directly in one lower panel. Each maturity is color‑coded and labeled so you instantly see:
» Curve shape (steepening, flattening, or inversion)
» Where stress is building (short end spiking vs long end anchored)
» Risk‑on / risk‑off tone (steepening = expansionary, inversion = defensive)
» Macro regime shifts without needing a separate dashboard
Read more
https://usethinkscript.com/threads/yield-curve-chart-indicator-for-thinkorswim.521/
Last edited:

