



Scroll down to check out this week's must reads, carefully selected by uTS Moderators!

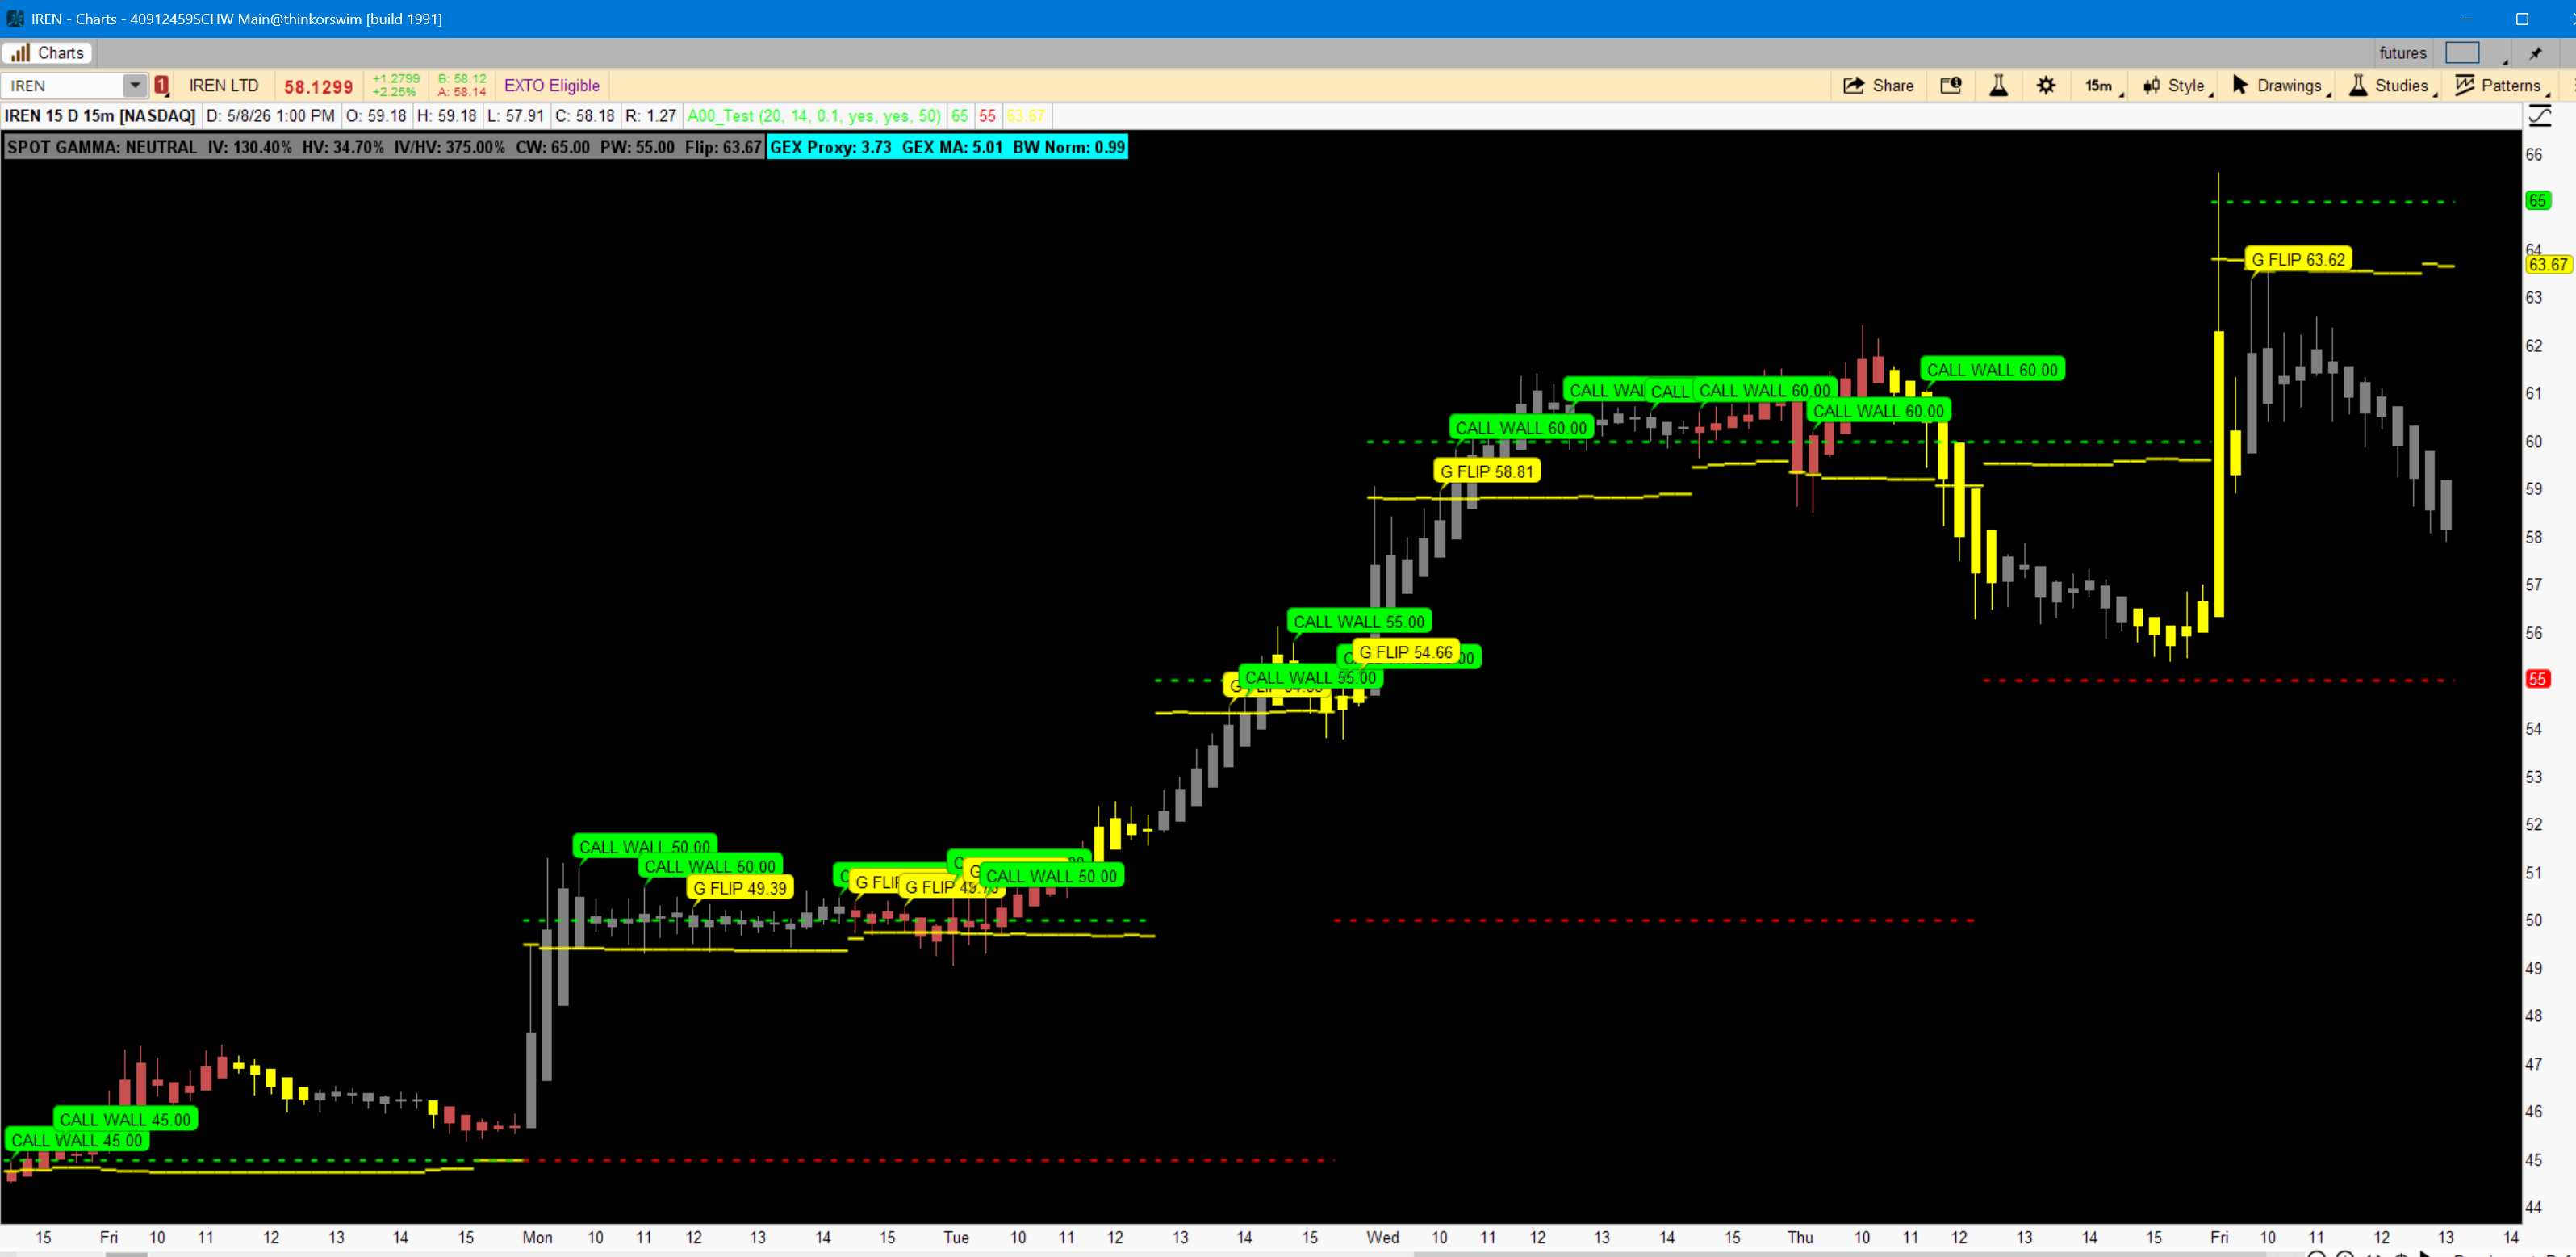
AGAIG Spot Gamma Indicator
csricksdds said:Indicator Derives a gamma exposure proxy from price action and IV.
METHOD: Gamma is highest near ATM and spikes when IV is low and expiry is near. This script uses:
• ImpVolatility() for the IV surface reading• Historical volatility vs IV ratio (GEX pressure proxy)• Price range compression/expansion for regime detection• ATR-normalized band width as a gamma environment signal
Read more
https://usethinkscript.com/threads/agaig-spot-gamma-indicator-for-thinkorswim.22406/
Market Memory Average (Zeiierman)
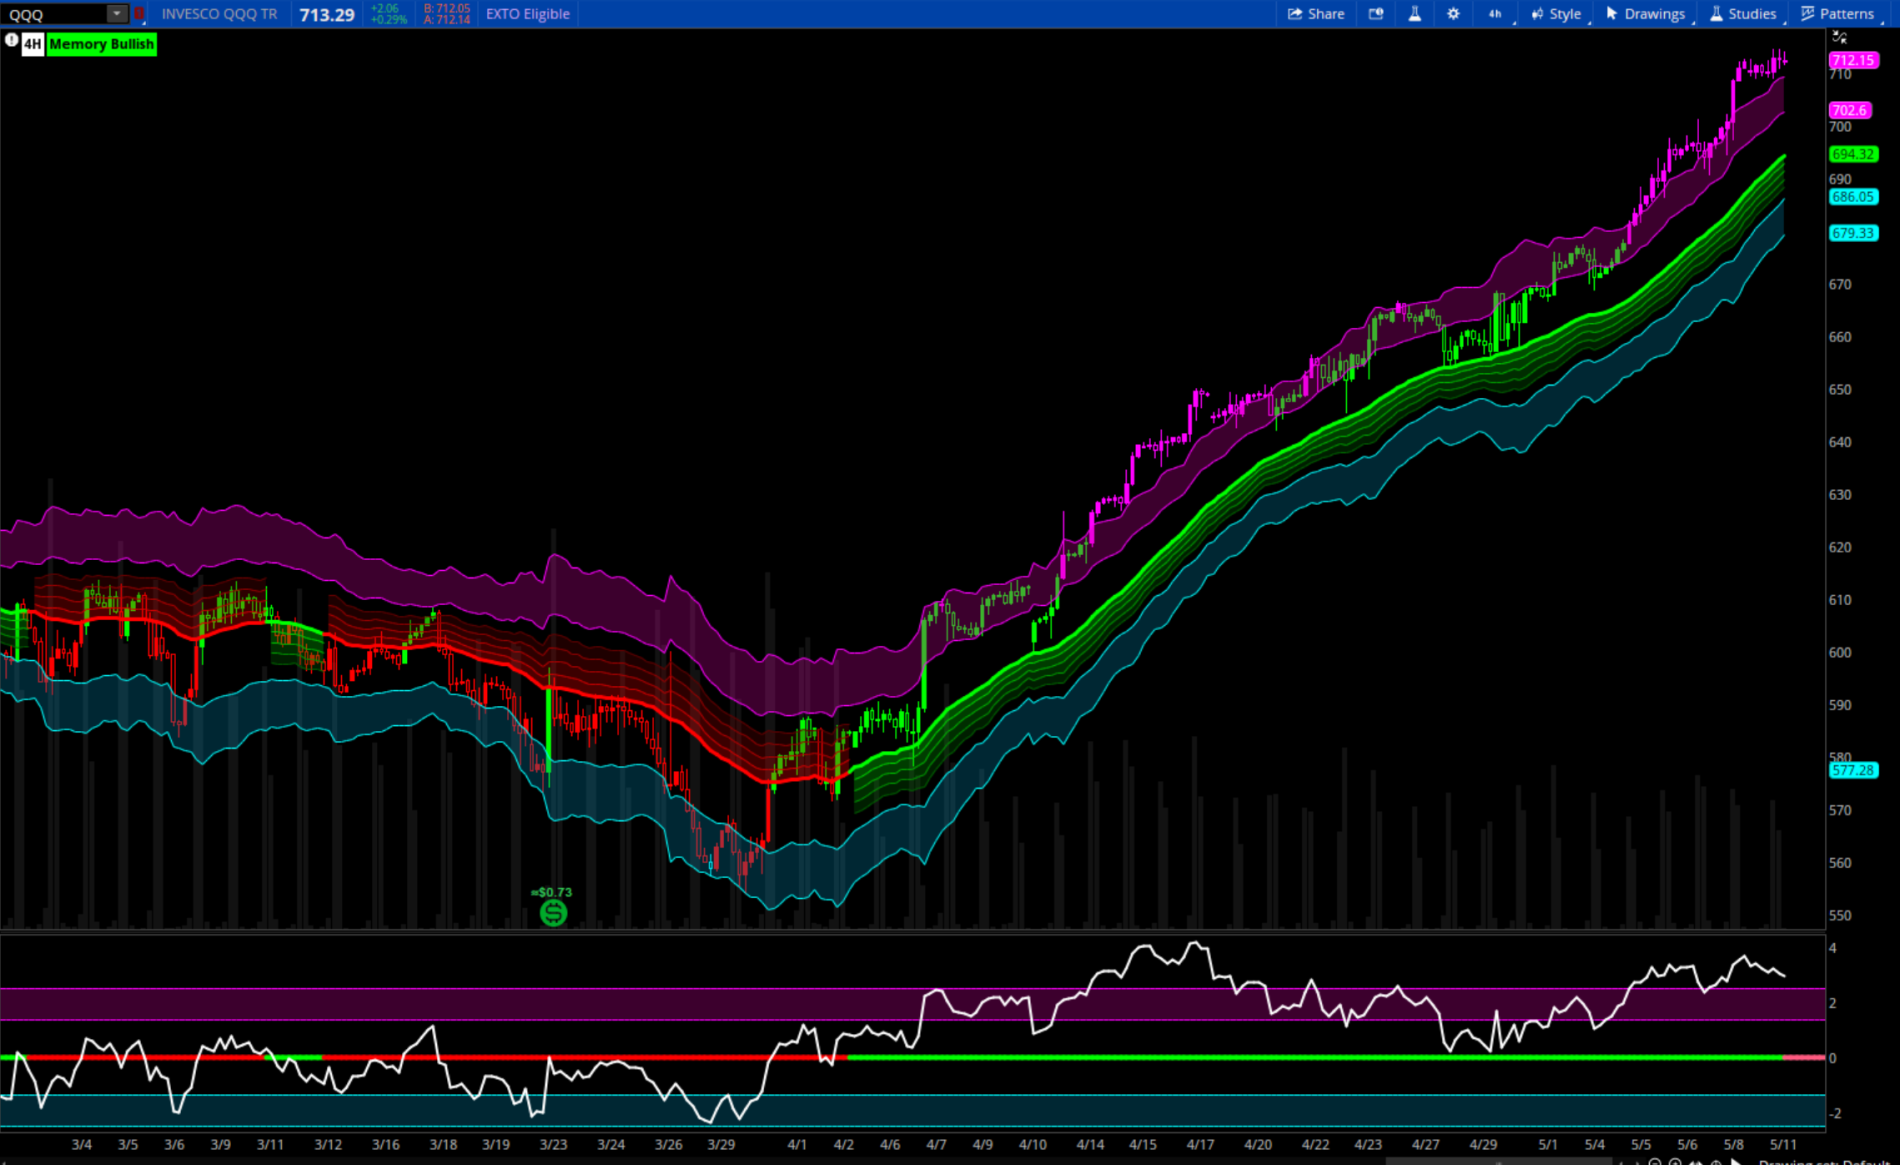
chewie76 said:What This Indicator Actually Is
At its core, Market Memory Average (MMA) is trying to answer one question:
“What has price done in similar conditions in the past, and what is it likely to do now?”
1. Market Memory (Similarity Engine)
Instead of just using RSI or moving averages, this model:
Looks at past market states (11–30 bars ago)
Compares them to the current market using:1-bar, 3-bar, and 5-bar momentum (ROC)
RSI level
Volatility (ATR)
Relative volume
Read more
https://usethinkscript.com/threads/...ierman-for-thinkorswim-upper-and-lower.22411/
VIP SUBSCRIBERS ONLY |
B-Xtender momentum plus Chande directional MOMO
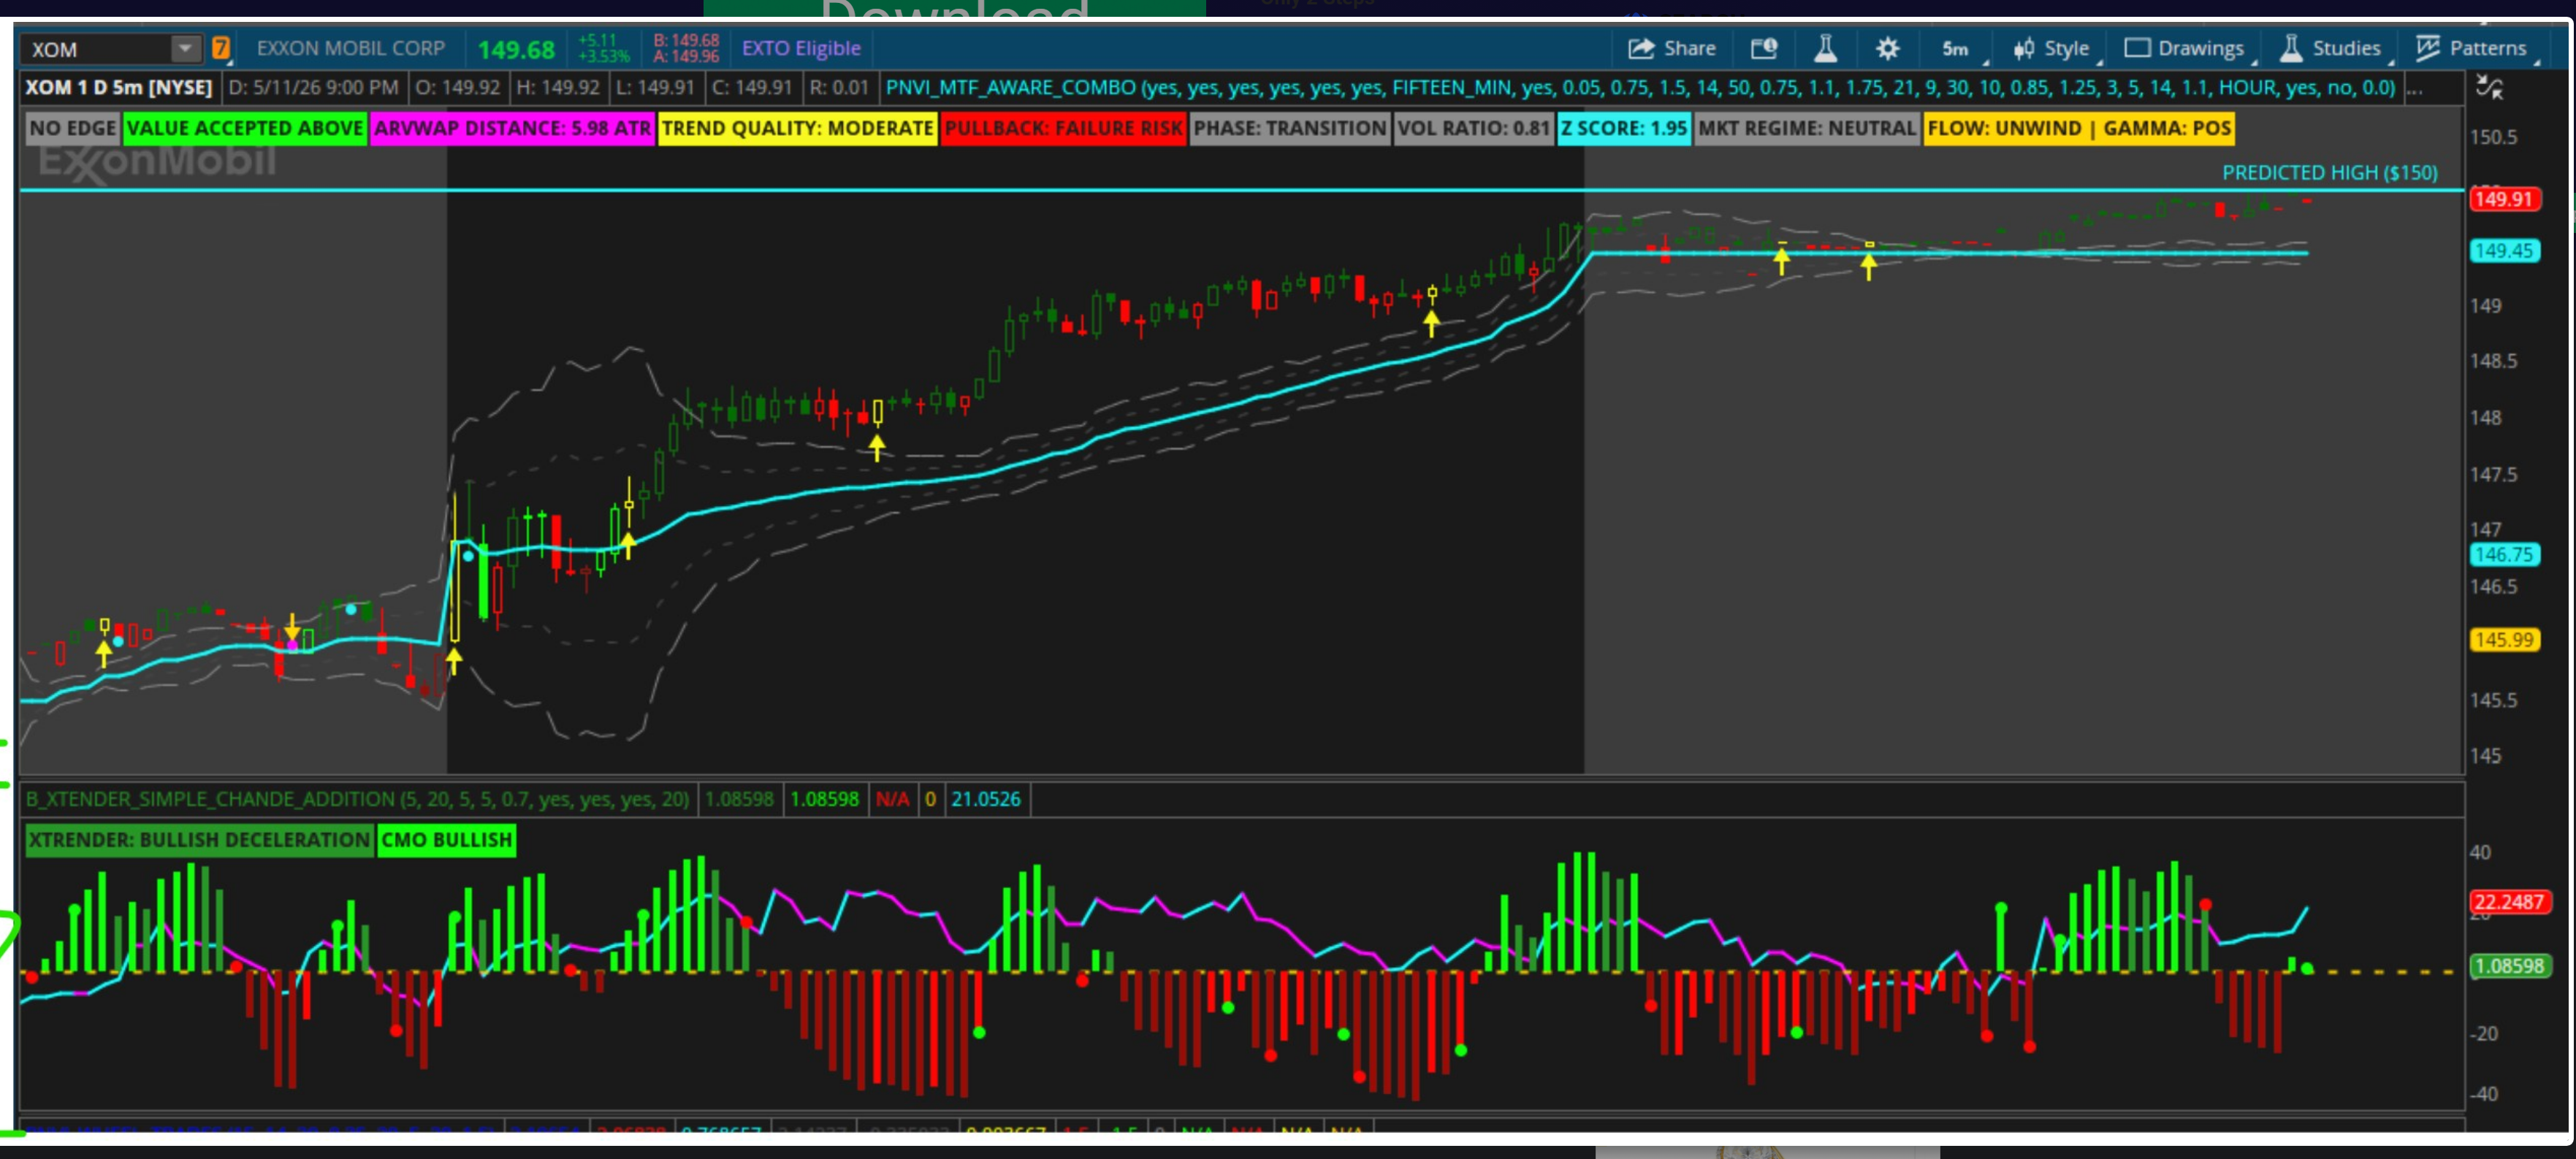
antwerks said:The B-Xtrender with Normalized Chande Momentum Oscillator (CMO) is a highly effective two-layer momentum system that combines acceleration and trend persistence into one unified lower-panel indicator. Think of the B-Xtrender as measuring how quickly momentum is changing, while the Chande Momentum Oscillator measures the underlying directional force of the trend. Together, they answer two of the most important trading questions: “Is momentum accelerating right now?” and “Is the larger trend still intact?” This makes the indicator particularly useful for identifying strong trending stocks, timing pullback entries, and determining whether to hold or reduce positions.
The B-Xtrender histogram is the primary visual component. It is centered around zero and color-coded into four states. Bright green bars indicate bullish momentum that is accelerating, which is typically the strongest continuation signal. Dark green bars indicate bullish momentum that remains positive but is slowing, often seen during healthy consolidations. Bright red bars indicate bearish momentum that is accelerating downward, while dark red bars indicate bearish pressure that is weakening. Because B-Xtrender is derived from the RSI of a fast and slow EMA spread, it reacts quickly to changes in momentum and often turns before price itself shows obvious weakness or strength.
Read more
https://usethinkscript.com/threads/b-xtender-momentum-plus-chande-directional-momo.22412/
Join our VIP Members Club to get access to our premium indicators including Buy The Dip, Advanced Market Moves and Take Profit.
Your VIP membership includes:
✓Full access to public & private forums
✓No Ads
✓Priority community support
✓Unlimited Postings
✓Premium thinkorswim indicators
✓Exclusive strategies, scanners, add-ons
✓Discord chatroom with Trade Alerts
VIP Membership
MA Trend State Cloud
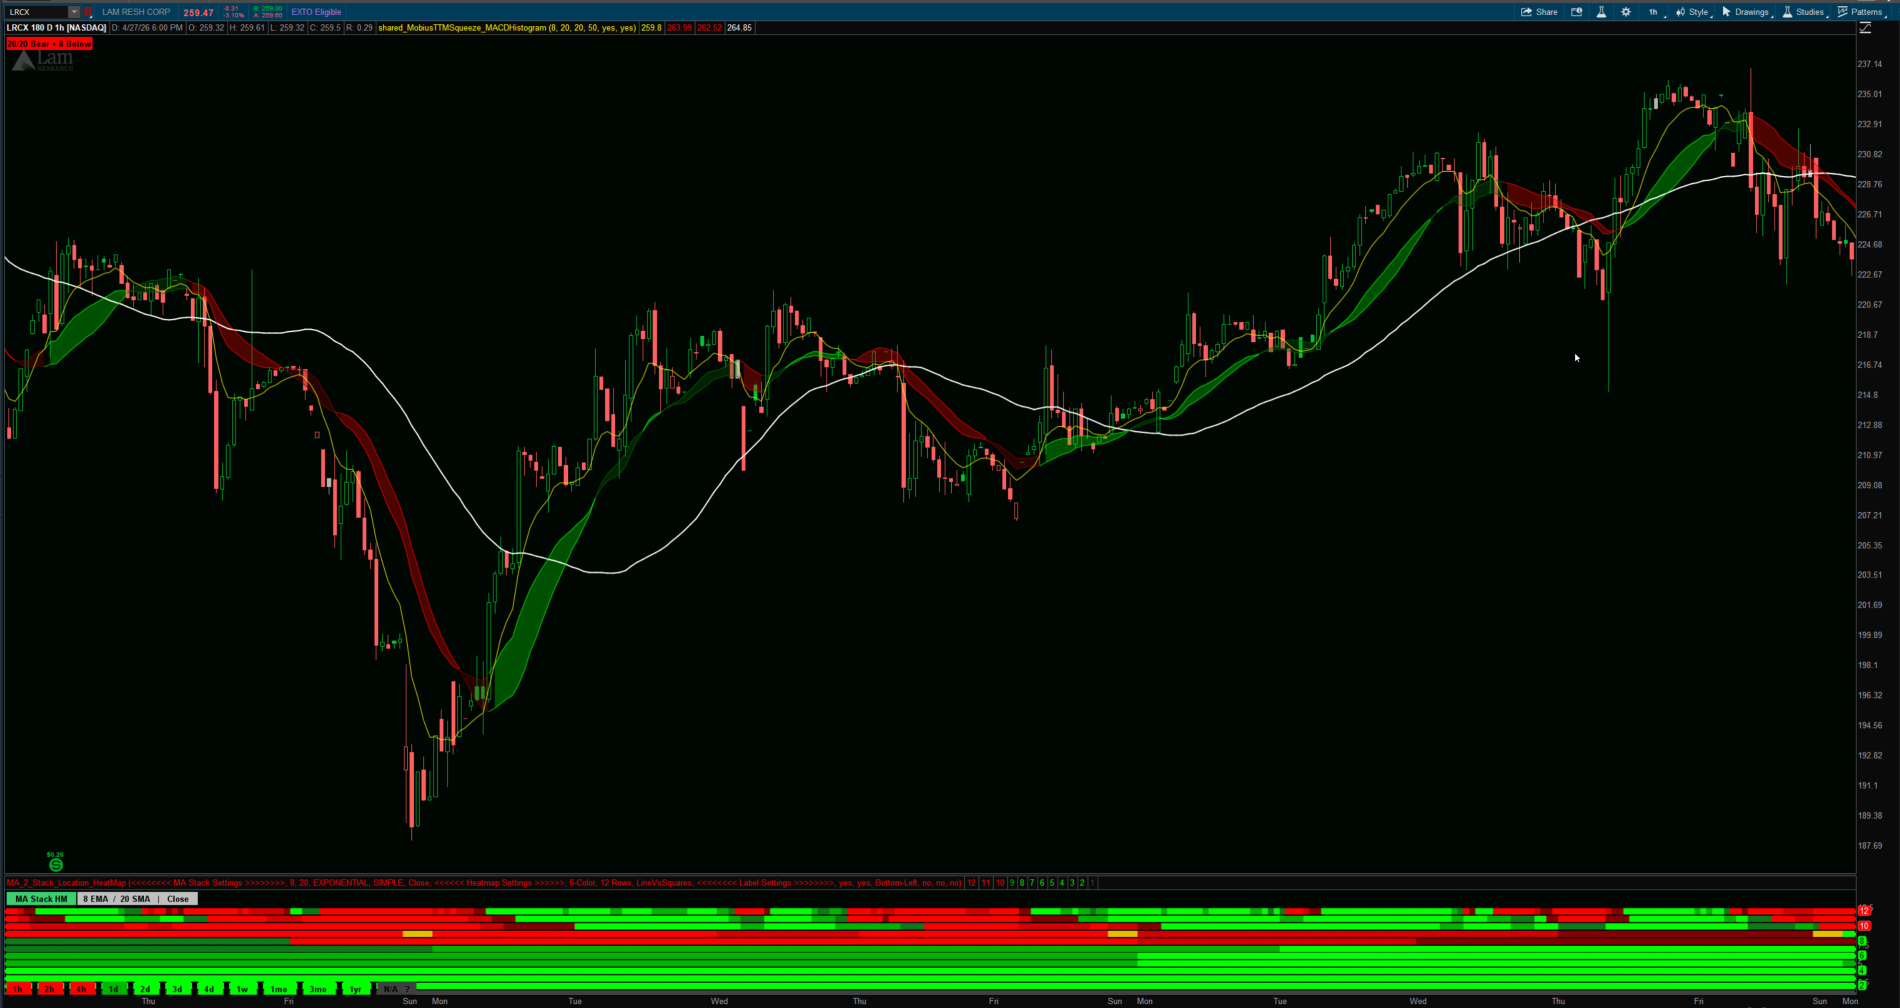
Ricky_005 shared:I’ve been stripping my chart down and testing a simpler trend structure built around an 8 EMA / 20 SMA / 20 EMA / 50 SMA.
The main idea is to let the 20 EMA and 20 SMA form a cloud so the chart gives a cleaner visual read of short-term trend condition, while the 8 EMA helps show whether price is still in control of that cloud or starting to lose it.
How I’m using it:
Green cloud = 20 EMA is above 20 SMA and the 8 EMA is above both 20s.
This is the strongest bullish condition.
Dark green cloud = 20 EMA is below 20 SMA, but the 8 EMA is still not below both 20s.
This tells me the bearish turn is not fully confirmed yet.
Red cloud = 20 EMA is below 20 SMA and the 8 EMA is below both 20s.
This is the strongest bearish condition.
Dark red cloud = 20 EMA is above 20 SMA, but the 8 EMA is no longer above both 20s.
This tells me bullish structure is weakening and may be rolling over.
Read more
https://usethinkscript.com/threads/ma-trend-state-cloud-for-thinkorswim.22384/
FROM THE ARCHIVES |
Finding the First and Last Bar of the day
korygill shared:One would think finding the first and last bar of the day in thinkscript would be easy.
I struggled to identify the first and last bars WITH extended session on and extended session off in the same study. I wrote this study, GetDayValues, to help me debug how to identify these so I could track PreviousClose and DayOpen bars in Magic Fibonacci 1.272 Indicator for ThinkorSwim v2.
I ran into issues around GetTime(), RegularTradingStart(), and RegularTradingEnd() and sometimes thinkscript would go a little bonkers and break my study if I wrote code in a certain way, which seemed valid at the time.
Sidebar: I will submit a feature request to the thinkscript to add a few built-in boolean values like IsFirstRegularBar, IsLastRegularBar, IsFirstExtendedBar, IsLastExtendedBar, IsRegularSession, IsExtendedSession, etc.
So what did I finally use to determine this?
Read more
https://usethinkscript.com/threads/finding-the-first-and-last-bar-of-the-day-in-thinkorswim.526/
Last edited:

