



Scroll down to check out this week's must reads, carefully selected by uTS Moderators!

Adaptive Market State Indicator
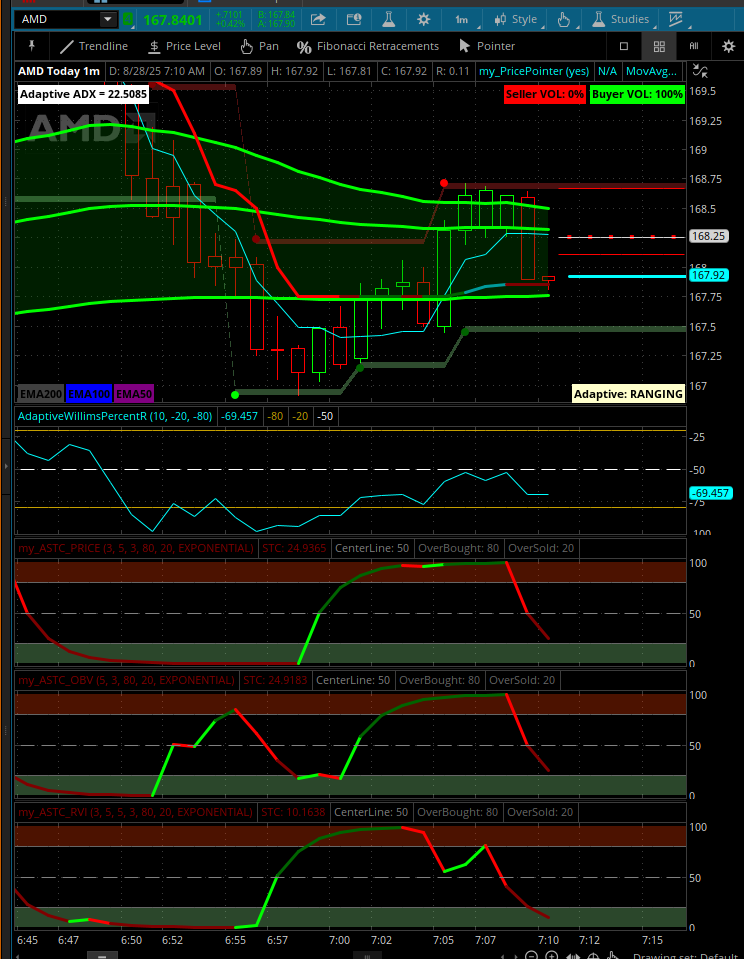
Sesqui said:Have you ever noticed that extra zing to the price action when trading with the trend? To help better identify the market state the script below modified the Dr Ehlers CorrelationCycleMarketState indicator to make it adaptive to the dominant market cycle using the EhlersAutocorrelationPeriodogram.
As a result the indicator tells you if the market is trending up, down or is ranging. And it uses the dominant market cycle to do that to ensure there is no question as to whether its length is set right.
The market state is displayed in a simple label on the bottom right side of the price chart.
Read more
https://usethinkscript.com/threads/adaptive-market-state-indicator-for-thinkorswim.21504/
Volume Labels
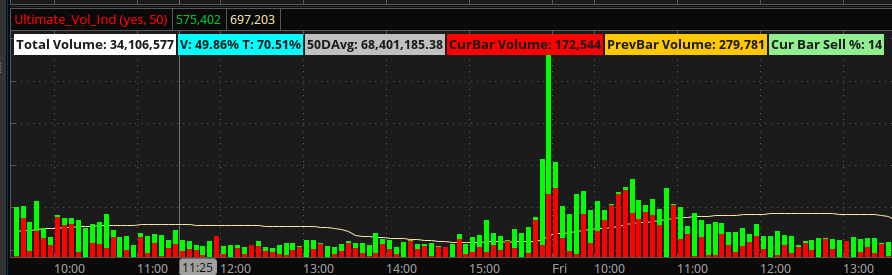
rnephosCloudMam said:I ran across some thinkScript label that has helped me see comparative volumes at a glance.
On my charts I have them in the Lower Charts (where I use the Ultimate_Volume_Indicator). I don't know who wrote the script. It wasn't in the notes. My contribution was adding a calculation to give the percent calculation showing percent of this day's volume to the average daily volume AND the percent of time elapsed through the day in hours.
Read more
https://usethinkscript.com/threads/volume-labels-for-thinkorswim.21545/
VIP SUBSCRIBERS ONLY |
RTH vs. Pre-Market: Using Separate Workspaces
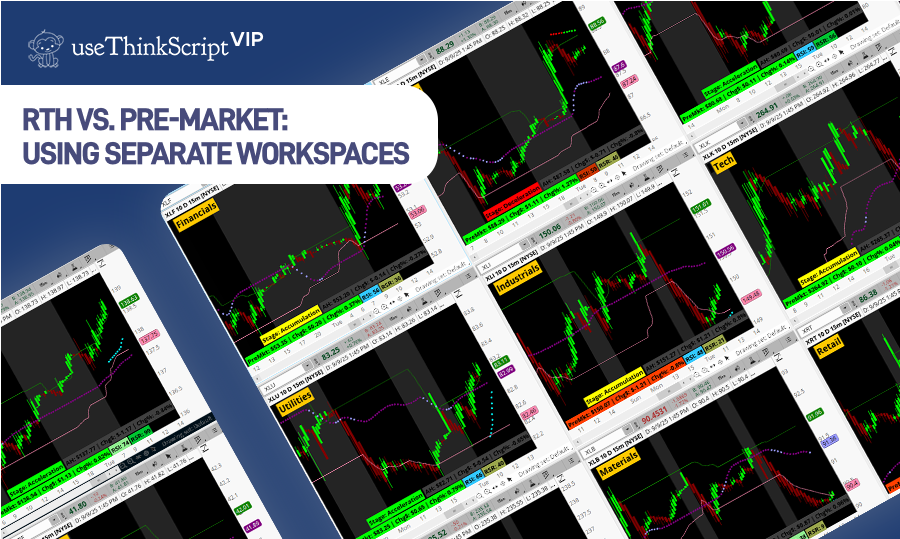
MerryDay said:Analyzing charts during regular trading hours (RTH):
Premarket data is typically excluded.
The reason is simple: premarket activity tends to be either extremely quiet or highly volatile, with a fraction of RTH volume. As a result, indicators that depend on lookbacks or volume can become heavily distorted if premarket data is included.
Much of my own analysis happens outside RTH. I often look to see which instruments are setting up for the next session.
I look to take advantage of the overnight volatility. To do this effectively, I maintain separate workspaces tailored to each environment.
RTH Workspace: I use real-time price action along with...
Read more
https://usethinkscript.com/threads/rth-vs-premarket-using-separate-workspaces.21552/
 Unlock Thread
Join our VIP Members Club to get access to our premium indicators including Buy The Dip, Advanced Market Moves and Take Profit.
Your VIP membership includes:
✓Full access to public & private forums
✓No Ads
✓Priority community support
✓Unlimited Postings
✓Premium thinkorswim indicators
✓Exclusive strategies, scanners, add-ons
✓Discord chatroom with Trade Alerts
VIP Membership
Swing Trade Stocks Outperforming Market
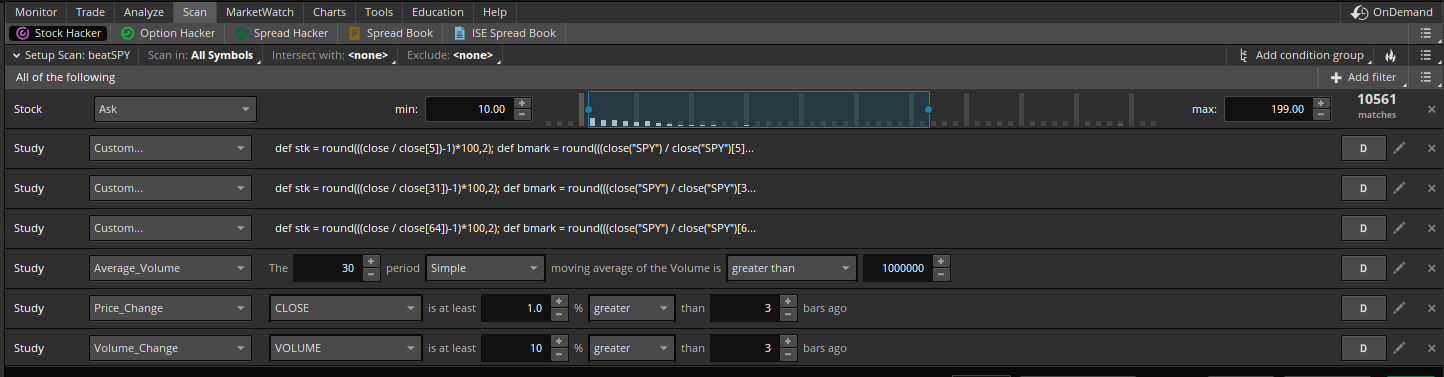
tellyt said:One of the best tools that TOS has is its scanner. For this choppy market I created a scanner that I run every Friday looking for Symbols that beat the SPY. I then use this watchlist for my trade ideas next week. It does not filter for Options . You will find there are some good stocks to trade that do not have options than make big moves.
I use all Symbols as my watchlist in case there are ETF funds to consider.
Read more
https://usethinkscript.com/threads/swing-trade-stocks-outperforming-market-in-thinkorswim.20950/
FROM THE ARCHIVES |
Renko Bar Based Trading System
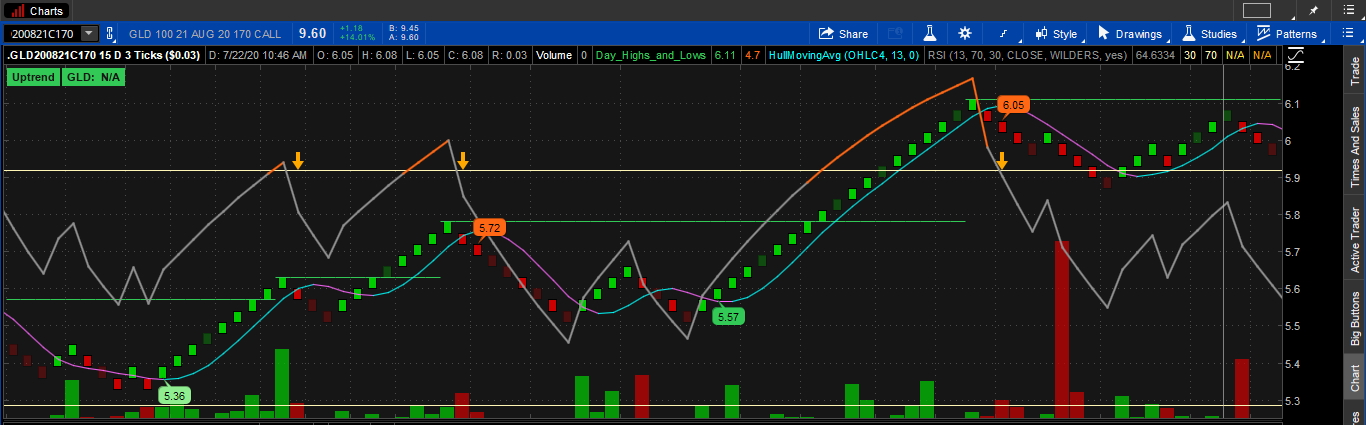
rad14733 said:I use Renko Bars for scalping and day trading rather than being fixated and totally consumed by trade-by-trade candle price action. The Time interval settings I use are usually between 1 to 15 day. Price range is usually set to whatever works best for a particular instrument, but usually between 2 - 15 Ticks or ATR for Equities and from 1 - 5 Ticks or ATR for Options.
Read more
https://usethinkscript.com/threads/renko-bar-based-trading-system-for-thinkorswim.3252/
Last edited:

