



Scroll down to check out this week's must reads, carefully selected by uTS Moderators!

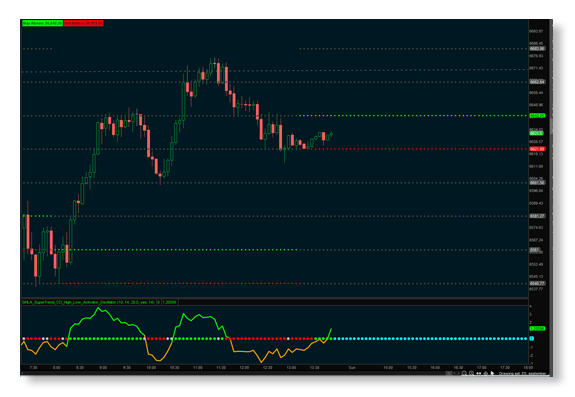
GHLA SuperTrend CCI HighLow Activator
cando13579 said:A multi-layered trend and momentum indicator that combines Gann-inspired high/low levels, a SuperTrend mechanism, and a custom CCI oscillator.
It provides dynamic entry and exit signals, confirming bullish or bearish trends while filtering out market noise. The accompanying oscillator visually represents trend strength and direction, allowing traders to quickly identify opportunities and avoid indecision zones.
Read more
https://usethinkscript.com/threads/ghla-supertrend-cci-highlow-activator-for-thinkorswim.21835/
Footprint Style Candles
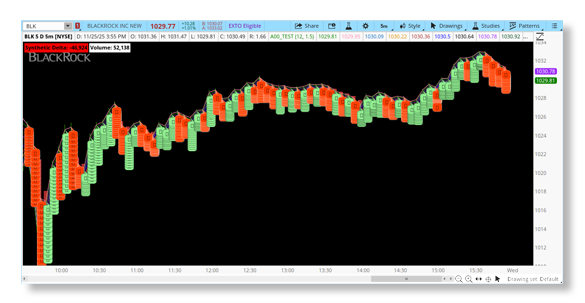
abhaydevgan asked:Day traders use this study to visualize a “synthetic footprint” inside each candle, helping them quickly gauge buying and selling pressure.
By dividing every candle into multiple rows and coloring each block based on an estimated delta (calculated from candle direction and volume), the script mimics volume-at-price without needing real bid/ask data.
This lets traders see whether buyers or sellers were dominant within the candle’s range, helping them spot momentum shifts, absorption, and potential reversals in real time.
Read more
https://usethinkscript.com/threads/footprint-style-candles-for-thinkorswim.21848/
VIP SUBSCRIBERS ONLY |
Gamma Delta Oscillator
antwerks said:This ThinkOrSwim script is designed to help traders spot important shifts in market behavior by comparing price momentum to implied volatility momentum. It acts as a visual “regime detector” for when the market is likely to change character—such as moving from calm trending to sudden volatility, or vice versa.
What Does It Actually Do?
Measures Divergence:
It calculates how much faster (or slower) implied volatility (IV) is moving compared to price. When IV is rising faster than price, it often signals that traders are hedging or expecting bigger moves ahead.
Highlights Extremes:
The script uses colored bars and threshold bands to show when this divergence is unusually strong, helping you quickly spot moments when the market might be about to break out, reverse, or become more volatile.
Trade Signals:
It can also highlight potential trade opportunities when both the oscillator and price action (like moving averages) line up, making it easier to act on these regime changes.
This script helps you visually detect when the market is about to shift gears—whether that’s a new trend, a volatility spike, or a regime change—by comparing price and volatility momentum and highlighting the most important moments to pay attention or act.
Read more
https://usethinkscript.com/threads/gamma-delta-oscillator.21811/
Join our VIP Members Club to get access to our premium indicators including Buy The Dip, Advanced Market Moves and Take Profit.
Your VIP membership includes:
✓Full access to public & private forums
✓No Ads
✓Priority community support
✓Unlimited Postings
✓Premium thinkorswim indicators
✓Exclusive strategies, scanners, add-ons
✓Discord chatroom with Trade Alerts
VIP Membership
Normalized Market Internals Oscillator
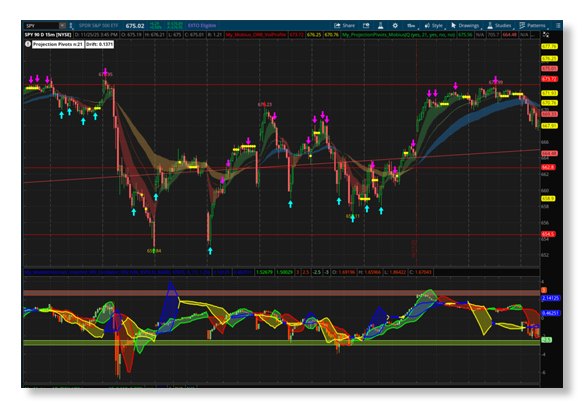
dart966 shared:I created 2 different lower indicators to view averaged Market Internals and the Inverted VIX:
Updated code to add a dashed vertical line when $TICK is +/- 800 or $TICK is +/- 1000
Added Strength Labels for $VOLD and $ADD as well as added $TICK
Read more
https://usethinkscript.com/threads/...lator-and-inverted-vix-for-thinkorswim.21849/
FROM THE ARCHIVES |
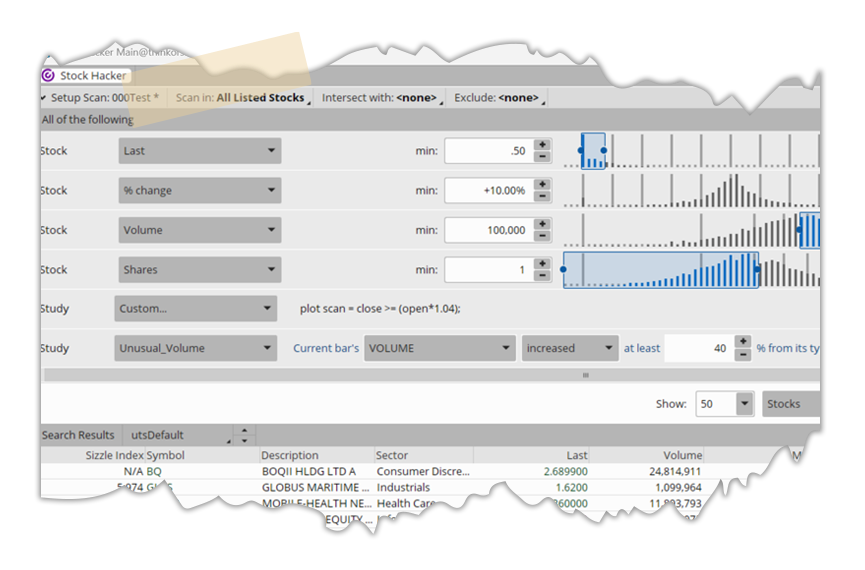
Relative Volume Strategy and Momentum Scanner
Sonny shared:I would like to share something interesting I found when trying to find high momentum stocks. Please see the other thread I posted under Indicators labeled "Color coded watchlist columns."
The RV1 value is very important in finding the strong stock of the day. When I ran my gap scanner around 9:32am, I found that the stock with the highest RV1 value tends to be very strong. For example, CBLI on 6/26, PDSB on 6/29, POLA on 6/30 and MYOS on 7/1. Each stock was a big winner on that day. So make sure to keep track of the gappers with the highest RV1 for big gains.
Read more
https://usethinkscript.com/threads/...gy-and-momentum-scanner-for-thinkorswim.3002/
Last edited by a moderator:

