



Scroll down to check out this week's must reads, carefully selected by uTS Moderators!

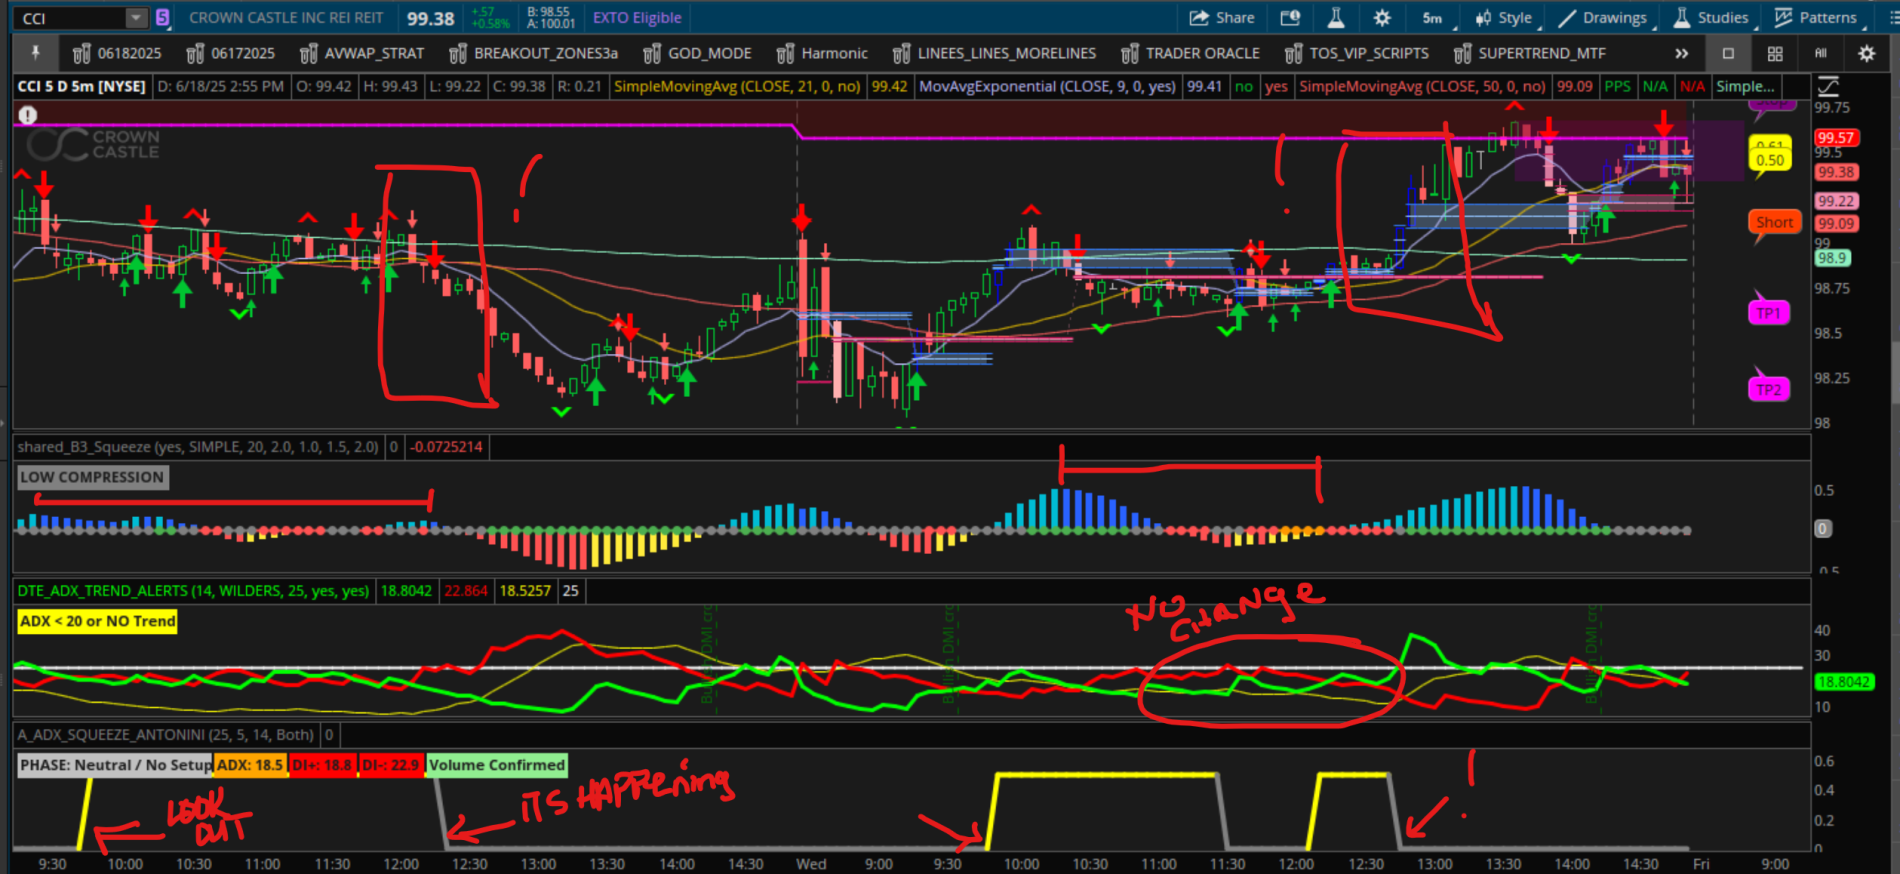
ADX Squeeze
antwerks said:I love the ADX indicators of all kinds but sometimes due to my physical computer set up I have "alot going on" so I needed something more simplistic in a visual. This is where this indicator comes from. (this can be used on all timeframes) This indicator gives a visual with labels of stocks where:
ADX, DI+, and DI- are all below a threshold (default 25)
And they stay under that threshold for a defined number of consecutive days (default 5)
This is a volatility compression setup — often referred to as a "squeeze" — which can precede breakouts or reversals. The assumption is Low directional movement (low ADX and both DI lines compressed) is an area of potential buildup before expansion.
Read more
https://usethinkscript.com/threads/adx-squeeze-for-thinkorswim.21167/
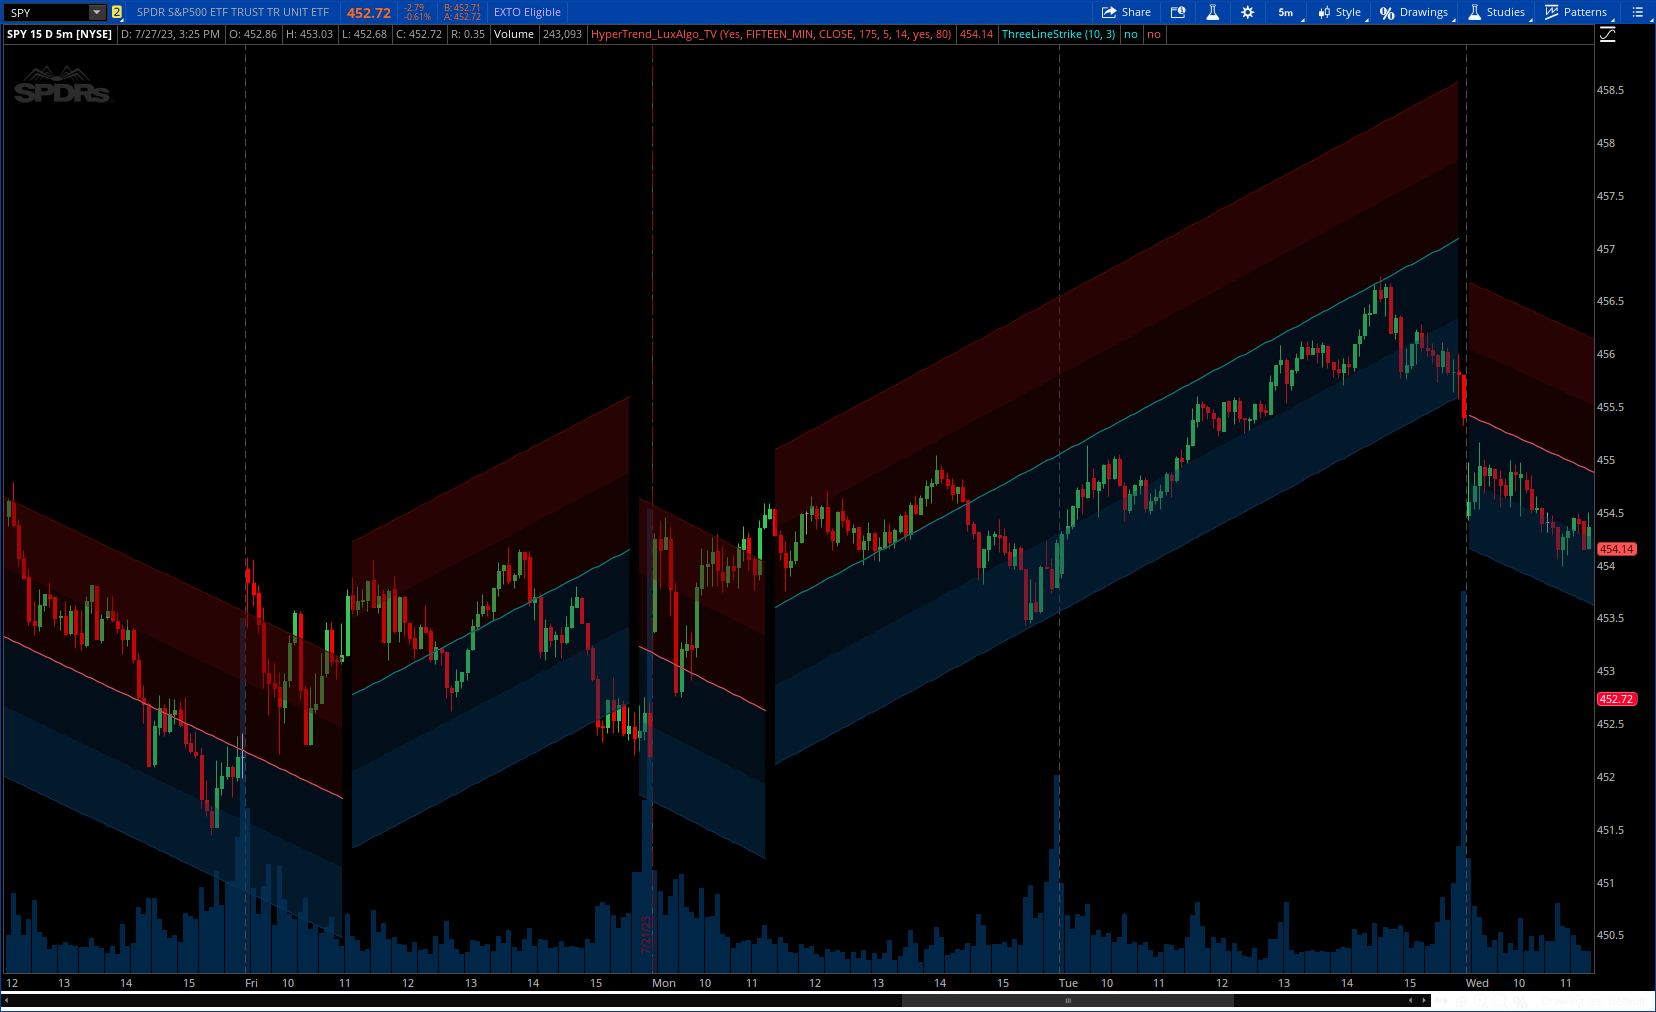
HyperTrend [LuxAlgo]
samer800 said:The HyperTrend indicator aims to provide a real-time estimate of an underlying linear trend in the price. Support and resistance extremities are constructed from this estimate which can provide trade opportunities within the overall trend.
Read more
https://usethinkscript.com/threads/hypertrend-luxalgo-for-thinkorswim.16188/
VIP SUBSCRIBERS ONLY |
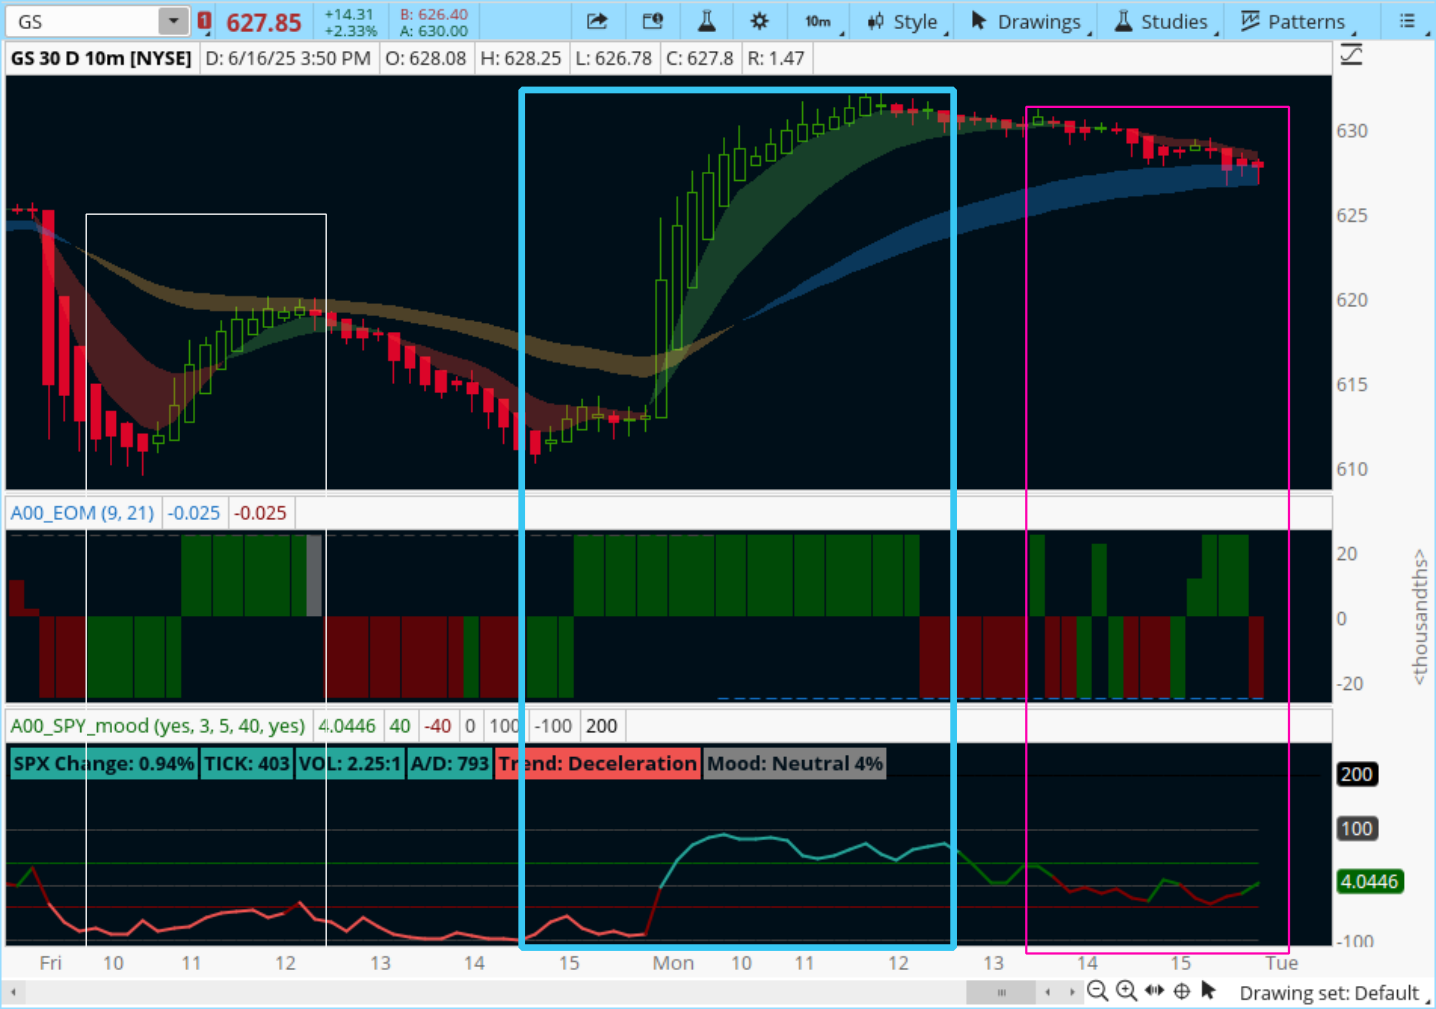
Ease Of Movement Indicator
useThinkScript said:The Forward-Looking Ease of Movement (EOM) Indicator isn’t the easiest tool for new traders to implement. The primary purpose of this indicator is to assess how easily or with how much difficulty a stock’s price can move in a particular direction.
Think of it like this:
EOM is like an app that tells you if the interstate is clear and sunny.
But just because conditions are great, it doesn’t mean you’re definitely going on a road trip. Maybe you’re busy, maybe you’re not feeling well, or maybe there’s some other reason...
Read more
https://usethinkscript.com/threads/ease-of-movement-indicator.21082/
 Unlock Thread
Join our VIP Members Club to get access to our premium indicators including Buy The Dip, Advanced Market Moves and Take Profit.
Your VIP membership includes:
✓Full access to public & private forums
✓No Ads
✓Priority community support
✓Unlimited Postings
✓Premium thinkorswim indicators
✓Exclusive strategies, scanners, add-ons
✓Discord chatroom with Trade Alerts
VIP Membership
Close vs Open
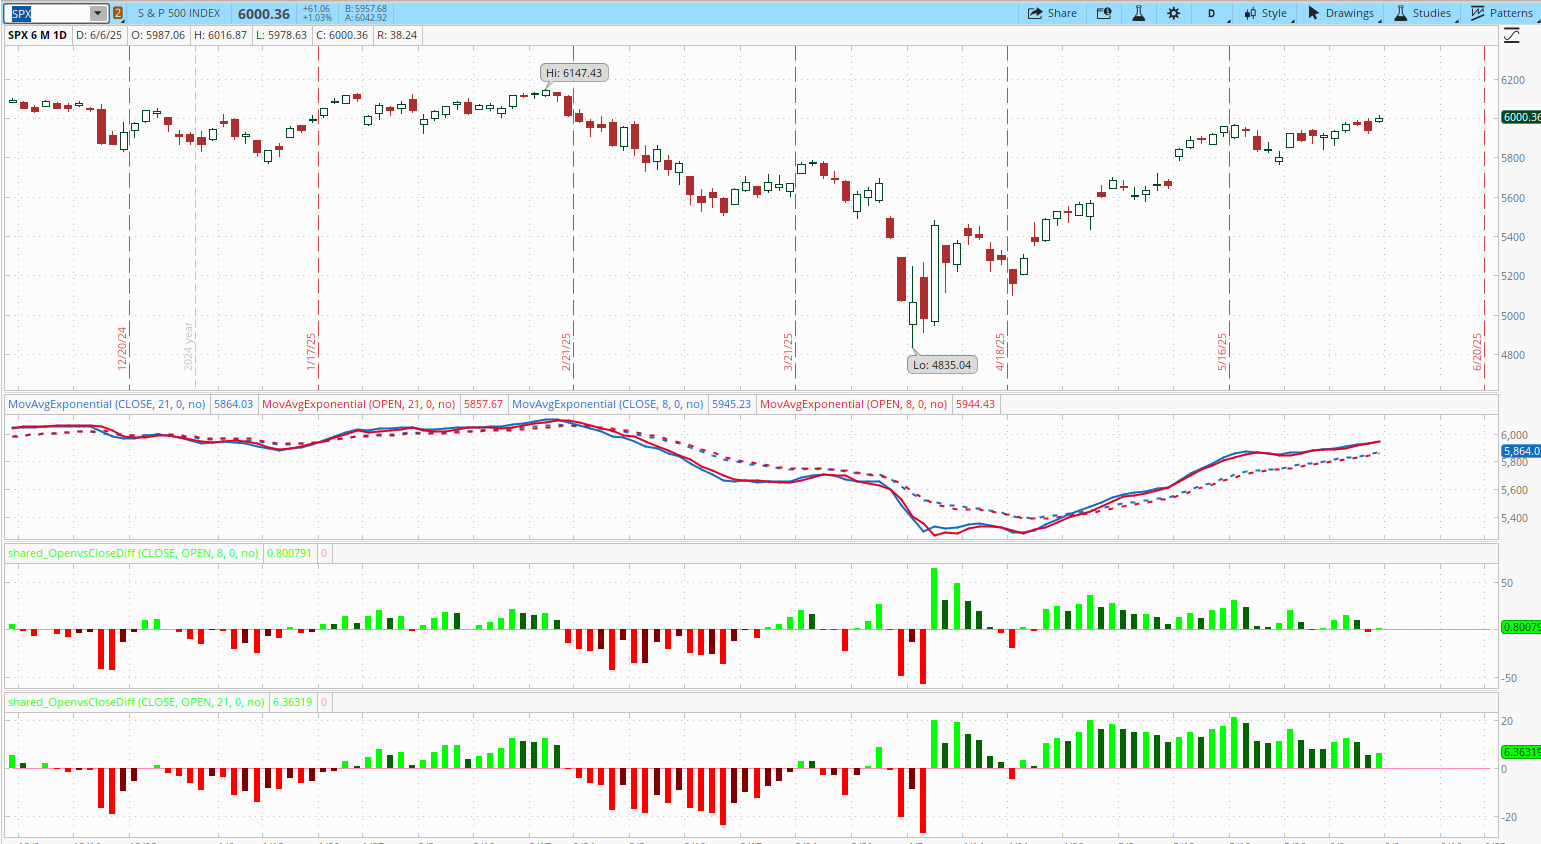
PonchoMike said:Several years back, I saw a video where someone noted that when the market is bullish, it typically closes higher than it opens. After some thinking, I decided to plot moving averages of the open and closing price on the same chart. I played around with a couple of different moving averages, eventually settling on the 8 and 21 ema. I further refined it by calculating the difference between the two moving averages and making it a histogram.
Below is what the chart looks like The blue line is the exponential moving average of the close, the red line is the moving average of the open. The solid lines are based on the 8 ema, the dashed lines are based on the 21 ema.
Read more
https://usethinkscript.com/threads/close-vs-open-for-thinkorswim.21131/
FROM THE ARCHIVES |
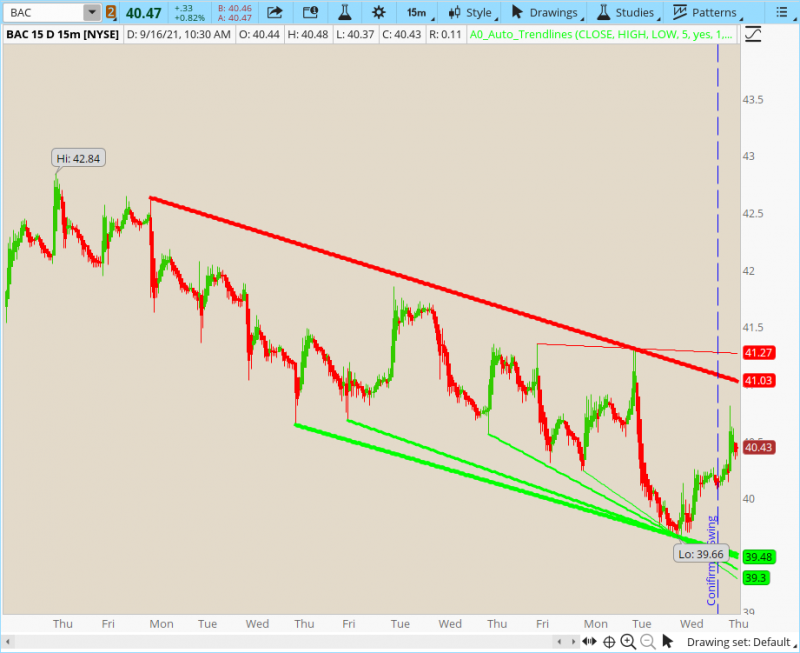
Auto Trend Lines
Trader_Rich said:I came across this "auto trend" indicator and while the auto trend lines are somewhat helpful, I'm finding that the vertical Confirmed Swing is great for further confirmation, and sometimes and early confirmation.
Unfortunately every time a new Confirmed Swing appears, the old one goes away. Would anyone have any idea how to code it so that they Confirmed Swing vertical lines don't disappear?
Read more
https://usethinkscript.com/threads/auto-trend-lines-for-thinkorswim.7979/
Last edited:

