



Scroll down to check out this week's must reads, carefully selected by uTS Moderators!

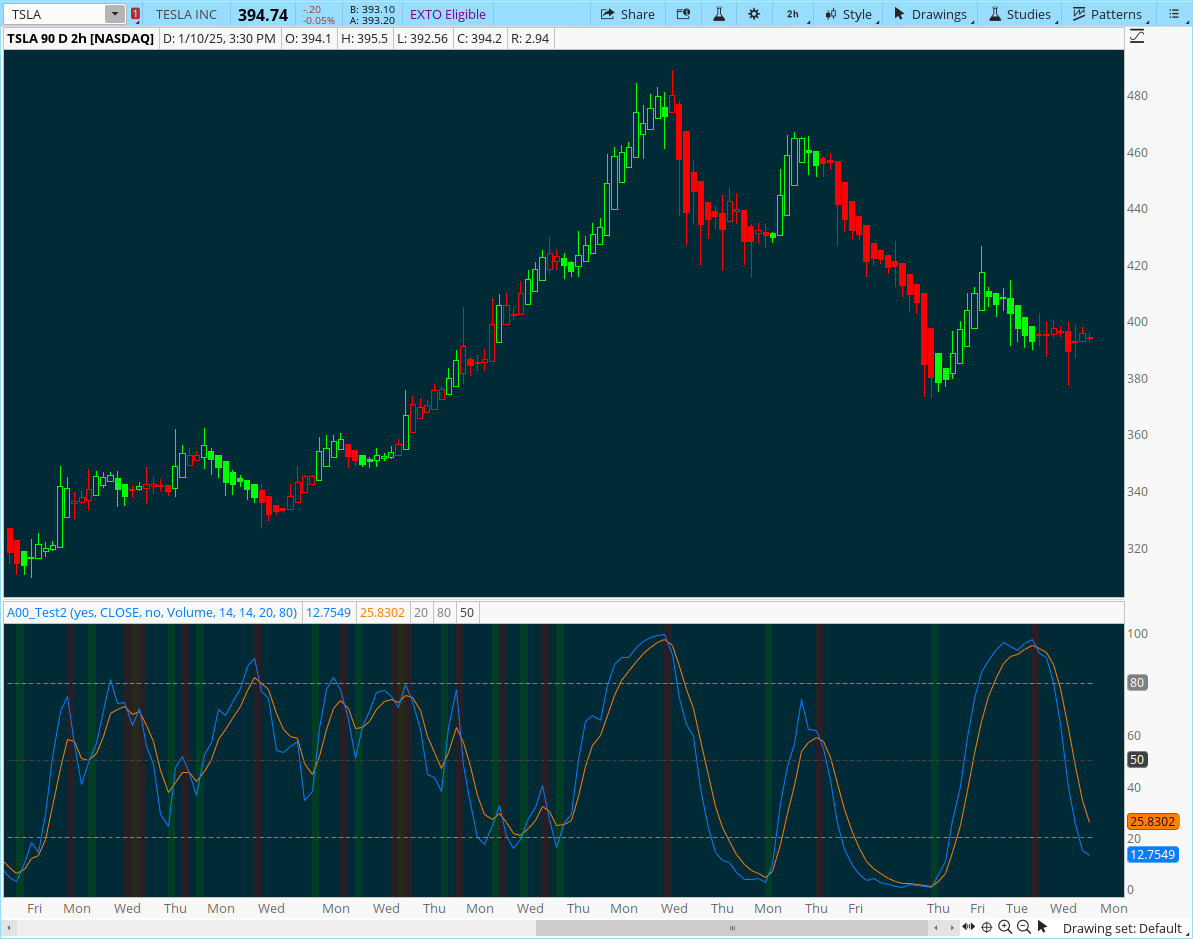
Stochastic Money Flow Index (SMFI)
samer800 said:The Stochastic Money Flow Index (SMFI) is a technical indicator that combines the Stochastic Momentum Index (SMI) with the Money Flow Index (MFI).
Its purpose is to provide a deeper insight into market dynamics by incorporating buying and selling pressure into momentum calculations, rather than relying solely on price movements.
The MFI is used as the input for the SMI, allowing the SMFI to capture momentum based on money flow rather than just price action. This approach helps traders better understand market sentiment and potential reversals.
Read more
https://usethinkscript.com/threads/stochastic-money-flow-index-smfi-for-thinkorswim.20325/
View Of Volume (VoV)
MatthewA said:View Of Volume (VoV). Calculations for Low Stress trading.
Global Capital functions through issuing currency and paying interest on debts. Arbitrarily massive sums of derivatives might exhaust the most intelligent minds that look for complex patterns to solve.
We can only understand relationships by seeing each thing relative to everything else. By looking through the lens of relativity, we may view the markets with more clarity and less stress
Read more
https://usethinkscript.com/threads/view-of-volume-vov-in-thinkorswim.17941/

VIP SUBSCRIBERS ONLY |
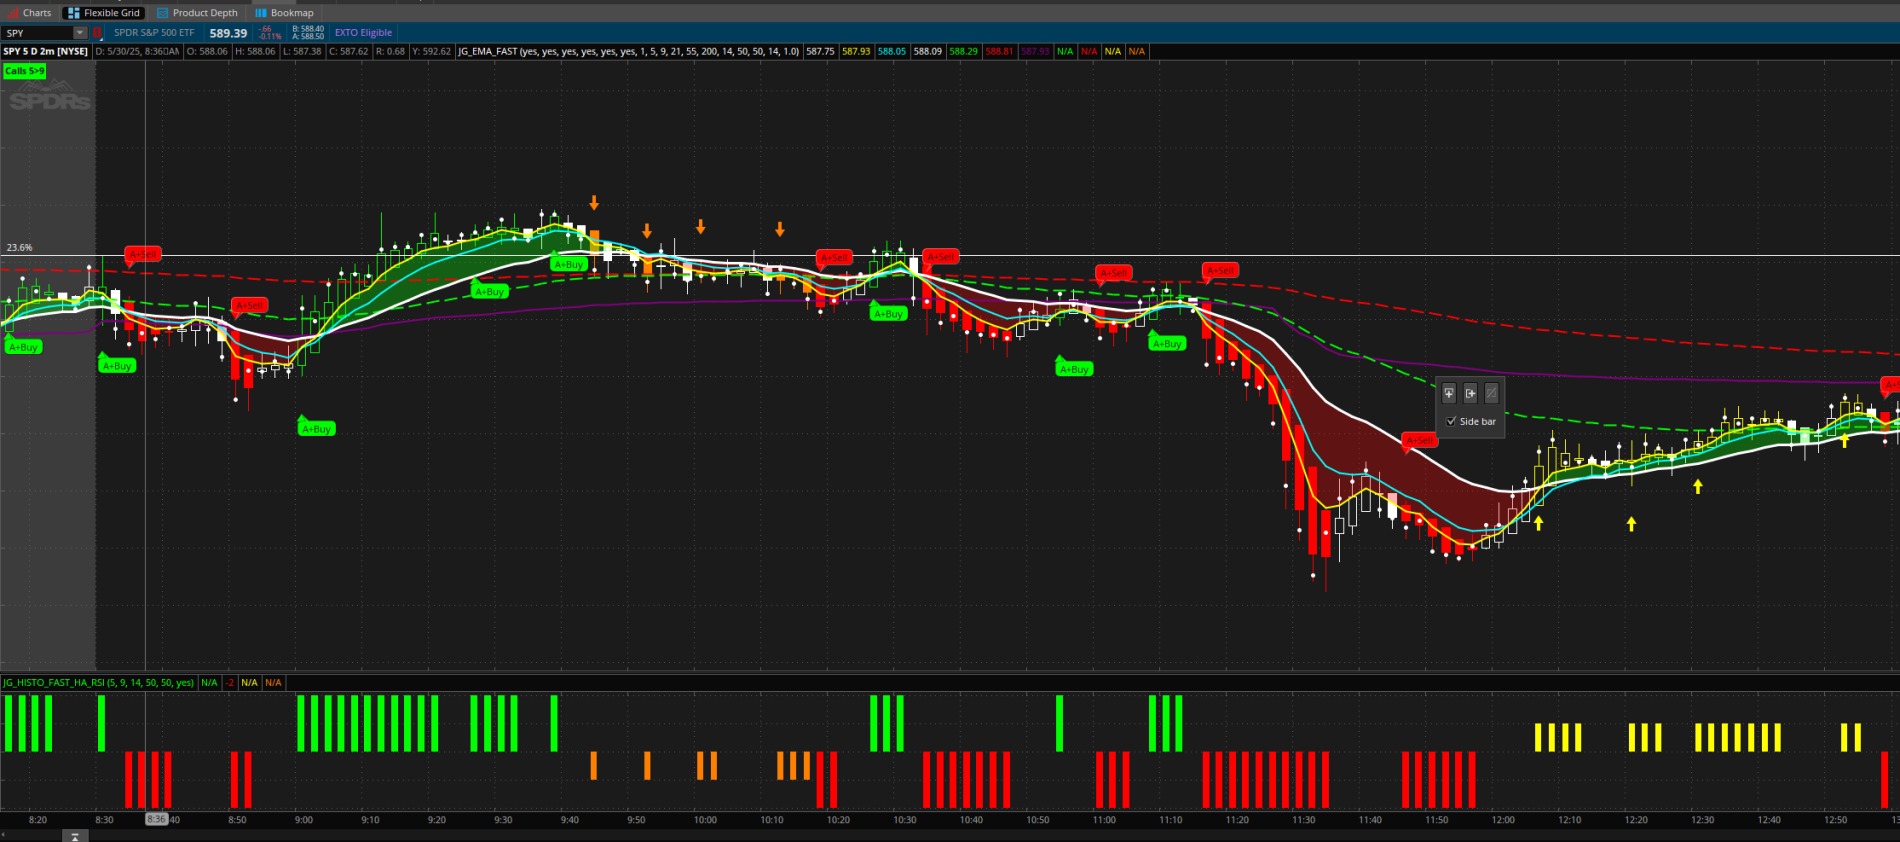
Day trade HA RSI Strategy Upper and Lower
Ajordan930 said:Here is my most recent HA set up that I have been using for some scalping. The script is using the 5 over 9 ema and requires 2 consecutive HA candles with price over 50 RSI (adjustable) to plot a bullish condition.
If price is below VWAP and conditions met will plot a yellow candle indicating a "potential reversal" and if over VWAP will plot a green candle. Shorts are red and potential reversal above VWAP are orange. I also created the lower version to plot as histograms consecutively. The top version only plots the 1st instance.
Read more
https://usethinkscript.com/threads/day-trade-ha-rsi-strategy-upper-and-lower.21102/
 Unlock Thread
Join our VIP Members Club to get access to our premium indicators including Buy The Dip, Advanced Market Moves and Take Profit.
Your VIP membership includes:
✓Full access to public & private forums
✓No Ads
✓Priority community support
✓Unlimited Postings
✓Premium thinkorswim indicators
✓Exclusive strategies, scanners, add-ons
✓Discord chatroom with Trade Alerts
VIP Membership
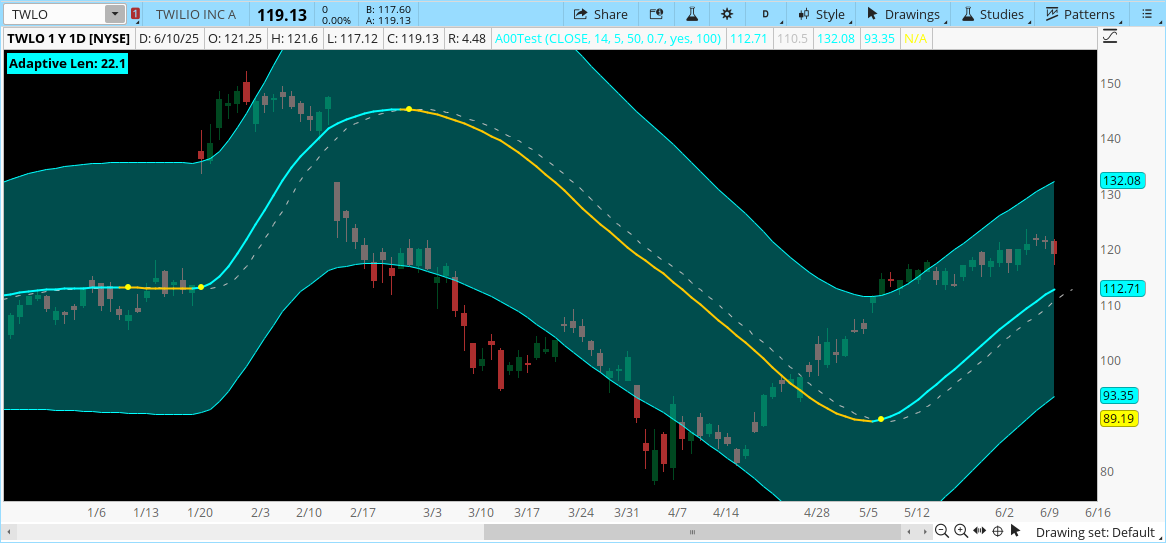
RSI-Adaptive T3 [ChartPrime]
rkwchu said:The RSI-Adaptive T3 is a precision trend-following tool built around the legendary T3 smoothing algorithm developed by Tim Tillson, designed to enhance responsiveness while reducing lag compared to traditional moving averages.
Current implementation takes it a step further by dynamically adapting the smoothing length based on real-time RSI conditions — allowing the T3 to “breathe” with market volatility. This dynamic length makes the curve faster in trending moves and smoother during consolidations.
Read more
https://usethinkscript.com/threads/rsi-adaptive-t3-chartprime-for-thinkorswim.21135/
FROM THE ARCHIVES |
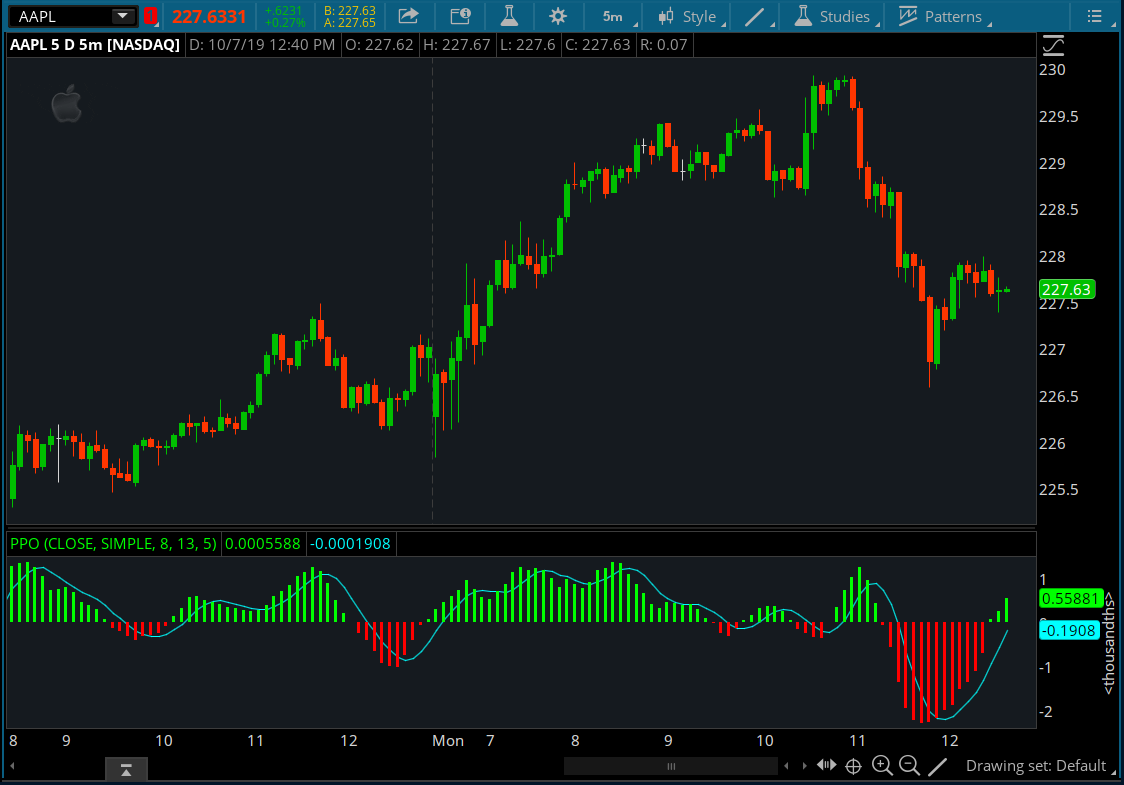
PPO (Price Percent Oscillator)
BenTen said:The Percentage Price Oscillator (PPO) is similar to Moving Average Convergence Divergence (MACD).
They are both momentum indicators used to gauge the strength and direction of a trend in a stock's price. Many times, they present with the same signals.
The PPO is considered superior in that the PPO is expressed as a percentage, making it easier to compare across different stocks and timeframes. Whereas the MACD has little comparitive value.
Read more
https://usethinkscript.com/threads/ppo-price-percent-oscillator-for-thinkorswim.778/
Last edited:

