



Scroll down to check out this week's must reads, carefully selected by uTS Moderators!

AVWAP for Daytrading
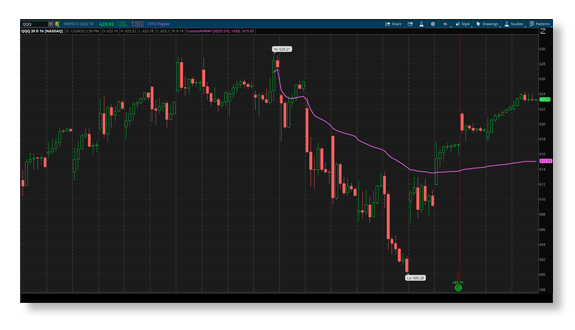
justAnotherTrader said:Today I want to introduce a very simple but very effective indicator. It is a custom Anchored VWAP that works based off a specific time.
The question this indicator answers is simple, are buyers mostly underwater or profitable based off the most recent rally. If buyers are mostly underwater, they are going to tend to want to get out and more likely to sell off the next rally. Pretty simple.
Likewise, if most traders are profitable, they will be more likely to defend dips and push rallies. Again, simple stuff.
The simplicity of this indicator is what makes it o powerful. Its not going to tell you whether or not to buy or sell, just whether or not market participants will be willing to support your thesis.
Read more
https://usethinkscript.com/threads/avwap-for-daytrading-for-thinkorswim.21977/
Volume To Act As Support & Resistance
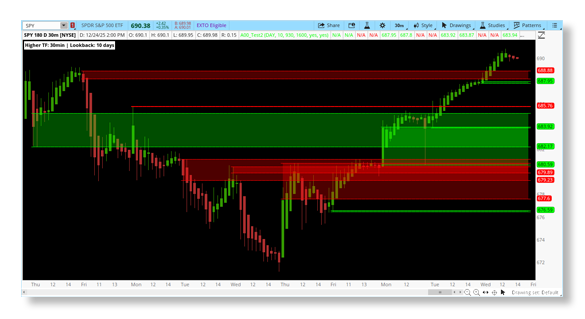
raj999 asked:Drawing the zones from the candle with respect to higher volume on 30 minutes candle on each day upto 5 days back(act as support and resistance) !!!!!
I view the 30 minutes chart where we can see in each day there is the highest volume bar, now with respect to that highest volume bar i want to draw zones on the candle . if the highest volume bar is Green then i want to create a zone on the candle from open to low of the candle however if the highest volume bar is Red then i want to draw a zone from high to open.
Read more
https://usethinkscript.com/threads/volume-to-act-as-support-resistance-for-thinkorswim.21887/
VIP SUBSCRIBERS ONLY |
Prior Period High Support Resistance Level
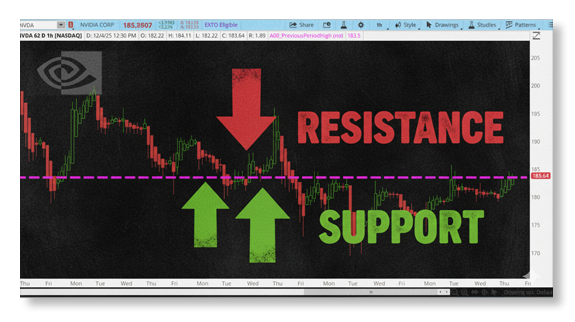
merrydays said:This script displays a single, significant horizontal line representing a high from a higher timeframe (HTF).
Previous period highs (PPHs) are critically important because they act as predictable, commonly observed, and self-fulfilling levels of resistance and support in the market.
Risk/Reward Analysis:
Resistance: When the price approaches a PPH, it's often a point where buyers hesitate and sellers step in. This creates an easy, observable level to set a price target (reward) or a limit order to short.
Support (Breakout):
If the price breaks and holds above the PPH, that line often flips its role and becomes a key support level. This provides a clear level to place your stop-loss (risk) when entering a long trade.
Algorithmic Targets:
Many algorithmic (algo) trading programs are explicitly coded to react to these widely recognized levels. They can trigger large buying or selling pressure when the price nears or violates a PPH, making the reaction at these points highly reliable for trading.
Read more
https://usethinkscript.com/threads/prior-period-high-support-resistance-level.21884/
Join our VIP Members Club to get access to our premium indicators including Buy The Dip, Advanced Market Moves and Take Profit.
Your VIP membership includes:
✓Full access to public & private forums
✓No Ads
✓Priority community support
✓Unlimited Postings
✓Premium thinkorswim indicators
✓Exclusive strategies, scanners, add-ons
✓Discord chatroom with Trade Alerts
VIP Membership
Ehlers Precision Trend
BlackCurtain shared:Hi, everyone, I've benefited greatly from many posts here, so wanted to share this that I created from the TASC article by John Ehlers. He calls it the Precision Trend Indicator.
John Ehlers introduces this method that uses two filters to remove unwanted "noise" from price data. These filters react very quickly to price changes, meaning the trend indicator they create closely follows the ups and downs of the market. When the indicator is above zero, it signals an uptrend, and when it's below zero, it indicates a downtrend. This makes it a helpful tool for spotting changes in market direction.
I have always been fascinated by Ehlers' work, especially the decycler and supersmoother. If anyone has ideas on how to use this indicator, please share. I'm not sure how useful it will be but it wasn't coded up in the TASC so I figured I'd take a try at it.
Read more
https://usethinkscript.com/threads/ehlers-precision-trend-for-thinkorswim.19556/
FROM THE ARCHIVES |
Breadth Thrust Indicator
SilverSurferAI shared:This script watches market internals (advancers/decliners, up/down volume, S&P price changes) and alerts you when the market shows rare “surge” behavior that historically marks major turning points.
Think of it as a market weather siren: it lights up when conditions shift dramatically.
Read more
https://usethinkscript.com/threads/breadth-thrust-indicator-for-thinkorswim.2131/
Last edited by a moderator:

