



Scroll down to check out this week's must reads, carefully selected by uTS Moderators!

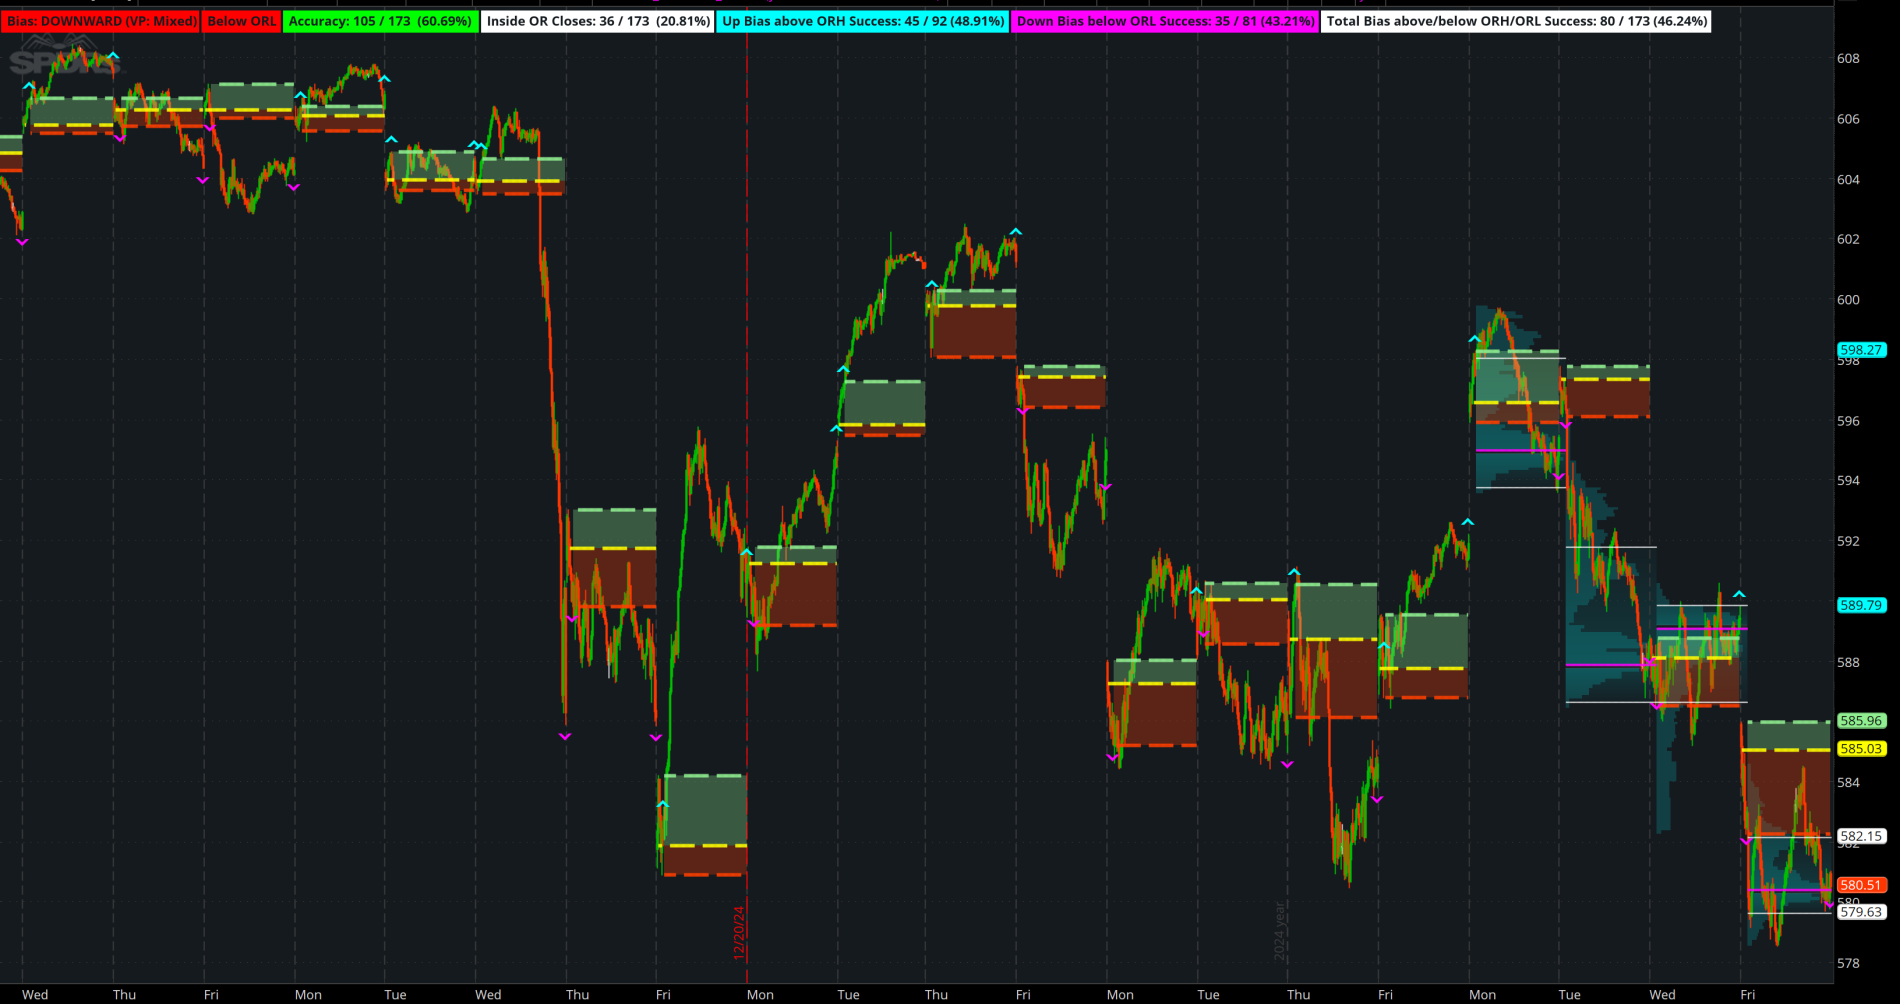
Testing Mobius ORB w/ Volume Profile
snoopydoopy said:Hi everyone! First time posting an indicator here so hopefully I do this correctly and coherently. Firstly I just want to say it right up front this is just an indicator, I am still working through how I want to use this as an actual strategy. There is also no buy or sell signals, this is an ORB indicator that tests out Mobius theory on the day bias has a 60 - 70% chance of being accurate. I also want to say that I am...
Read more
https://usethinkscript.com/threads/testing-mobius-orb-w-volume-profile-in-thinkorswim.20327/
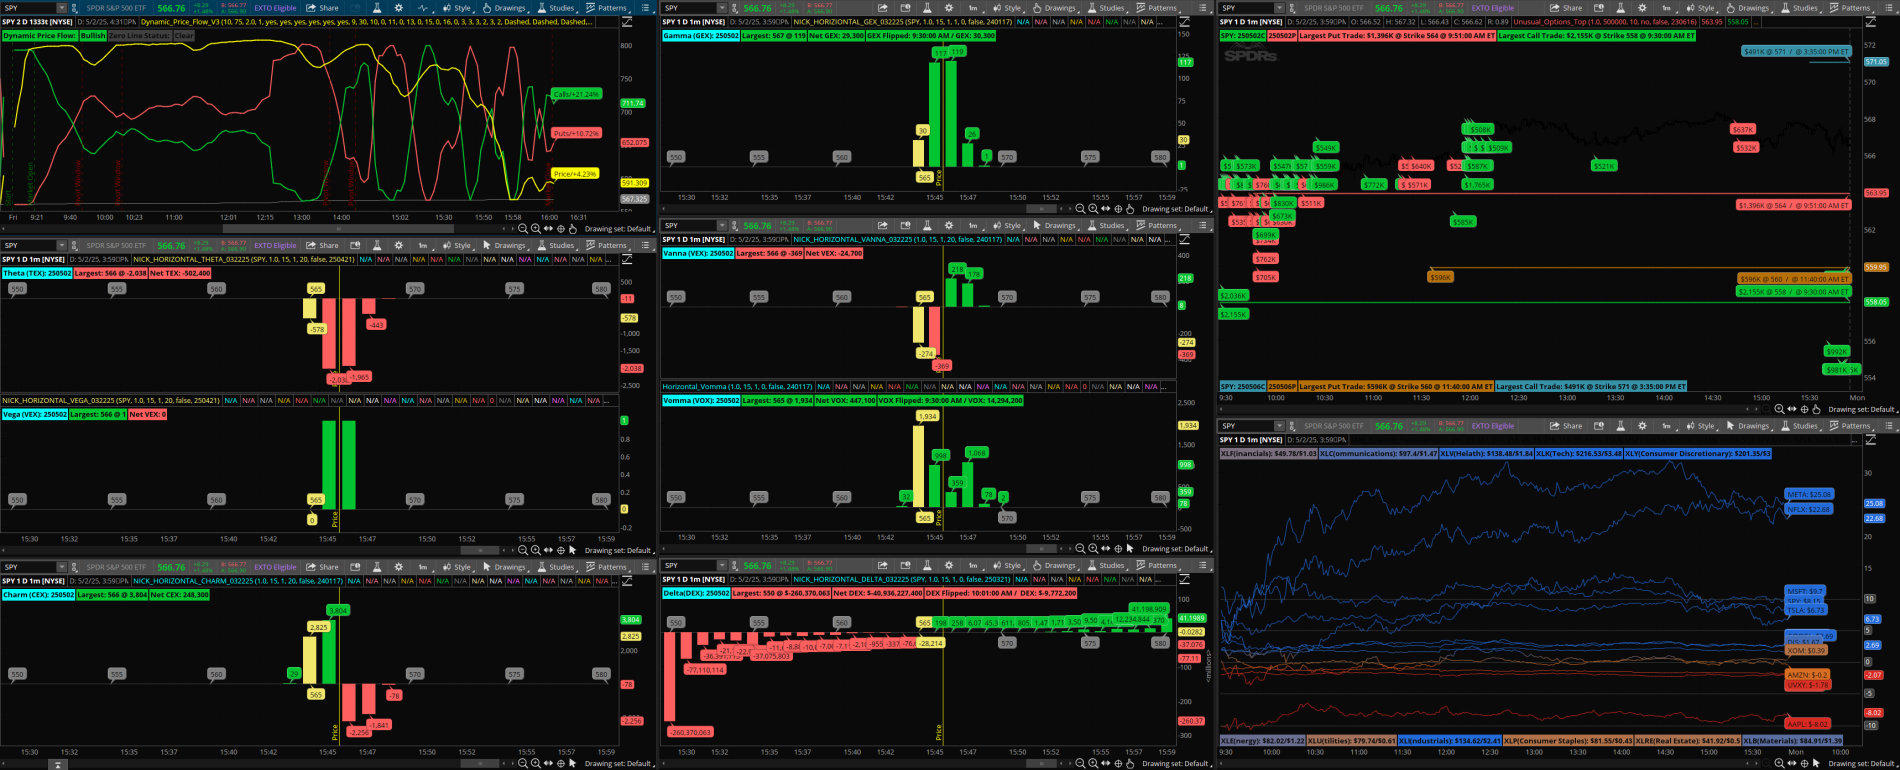
GoldenSniper Options Dashboard
BrooklynMintCapital said:Here is my trading dashboard. The Greeks and the Unusual Options are the brainchild of @2187Nick. I have done some additional modifications to make them hum a little.
The Dynamic Price Flow which is a play on Market Net flow comes from me, as well as the Magnificent 7 Heatmap with Sector Heatmap labels. To the excellent coders out there, go crazy, modify and do as you will...
The Delta Script: when NET DEX is red look for price to rise when green look for price to fall...
Read more
https://usethinkscript.com/threads/goldensniper-options-dashboard-for-thinkorswim.20997/
VIP SUBSCRIBERS ONLY |
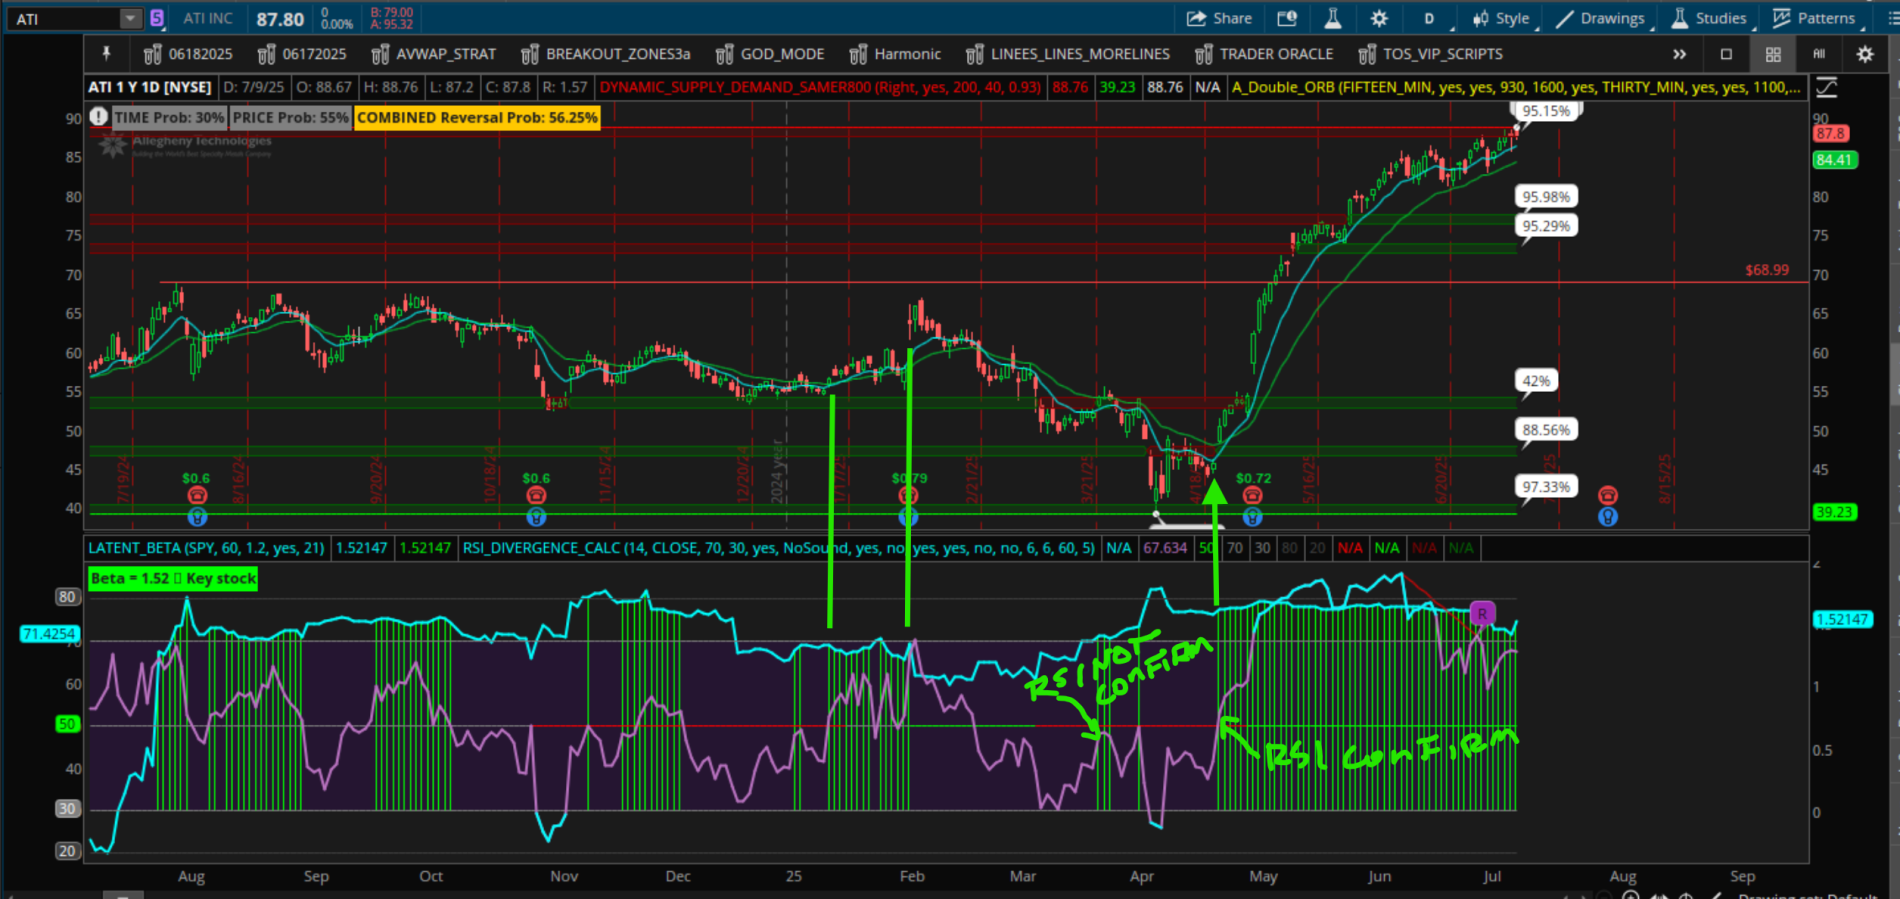
Latent Beta Indicator with Scanner
TRADERSAM said:Beta is a valuable indicator for stock selection because it helps assess risk and align investments with your risk tolerance, investment strategy, and market outlook
A normal Beta Trading Strategy fit is dependent on personal risk and your own strategy. Momentum Traders will favor high-beta stocks for quick, amplified moves. Value Investors prefer low-beta stocks for stability and undervaluation. Options Traders favor High-beta stocks that signal increase option premium volatility, aiding strategies like straddles.
Beta varies by sector. Tech and small-cap stocks typically have higher betas (1.2–2.0), while consumer staples and utilities have lower betas (0.5–0.8). Beta helps compare stocks within or across sectors. I am not using Beta in this way but to signal when optimum conditions turn on and off in terms of momentum and volatility...
Read more
https://usethinkscript.com/threads/latent-beta-indicator-with-scanner.21248/
 Unlock Thread
Join our VIP Members Club to get access to our premium indicators including Buy The Dip, Advanced Market Moves and Take Profit.
Your VIP membership includes:
✓Full access to public & private forums
✓No Ads
✓Priority community support
✓Unlimited Postings
✓Premium thinkorswim indicators
✓Exclusive strategies, scanners, add-ons
✓Discord chatroom with Trade Alerts
VIP Membership
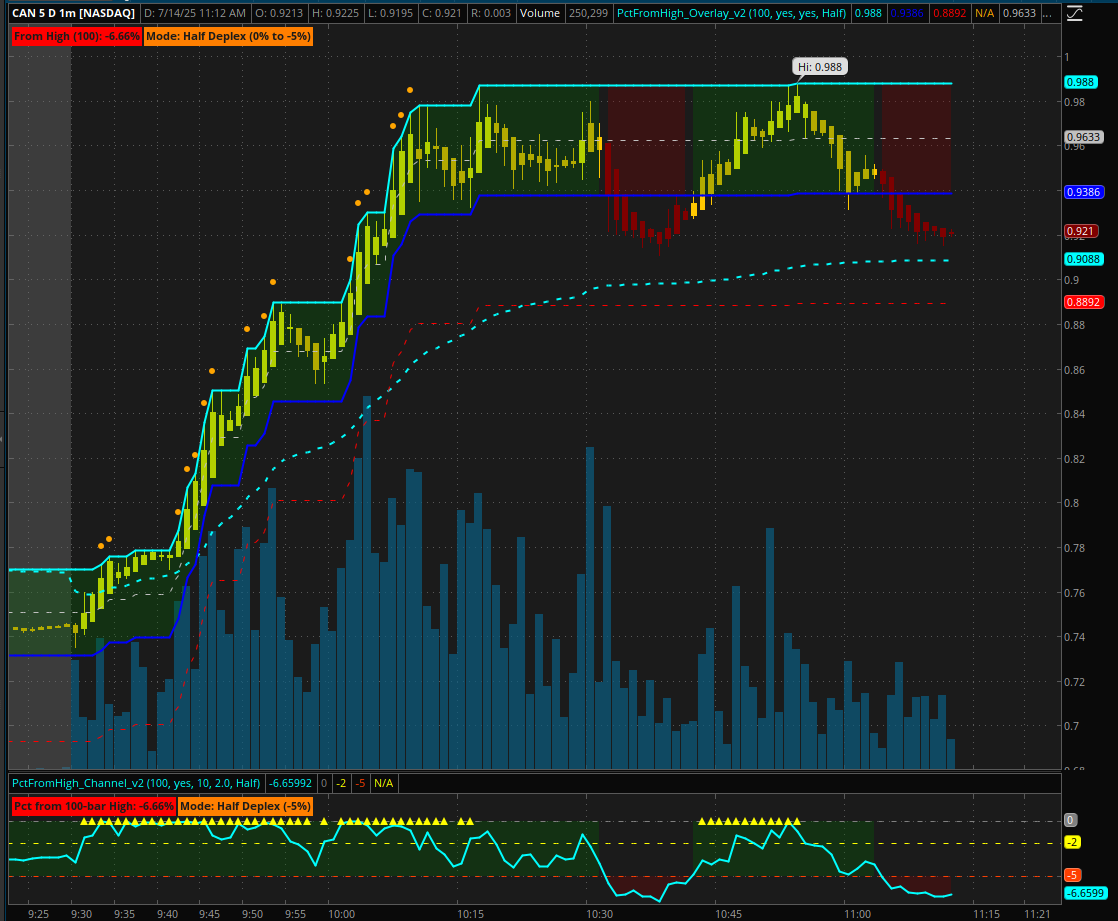
Percent From High Dynamic Channel + Breakout System
uplink said:This ThinkorSwim script, called "Percent From High Dynamic Channel + Breakout System", is specifically designed for trading low-float stocks, where momentum moves are fast and sharp pullbacks are common.
The script tracks how far the current price is from its recent high over a user-defined period (default is 100 bars), making it easier to spot breakout setups and healthy pullbacks. It offers two channel modes: Full (-10%) and Half (-5%), helping traders adjust sensitivity based on volatility. Candle colors shift dynamically: green highlights breakouts above the high, while yellow, orange, and dark green show controlled pullbacks into risk-managed entry zones.
Read more
https://usethinkscript.com/threads/...hannel-breakout-system-for-thinkorswim.21260/
FROM THE ARCHIVES |
ICT Donchian Smart Money Structure (Expo)
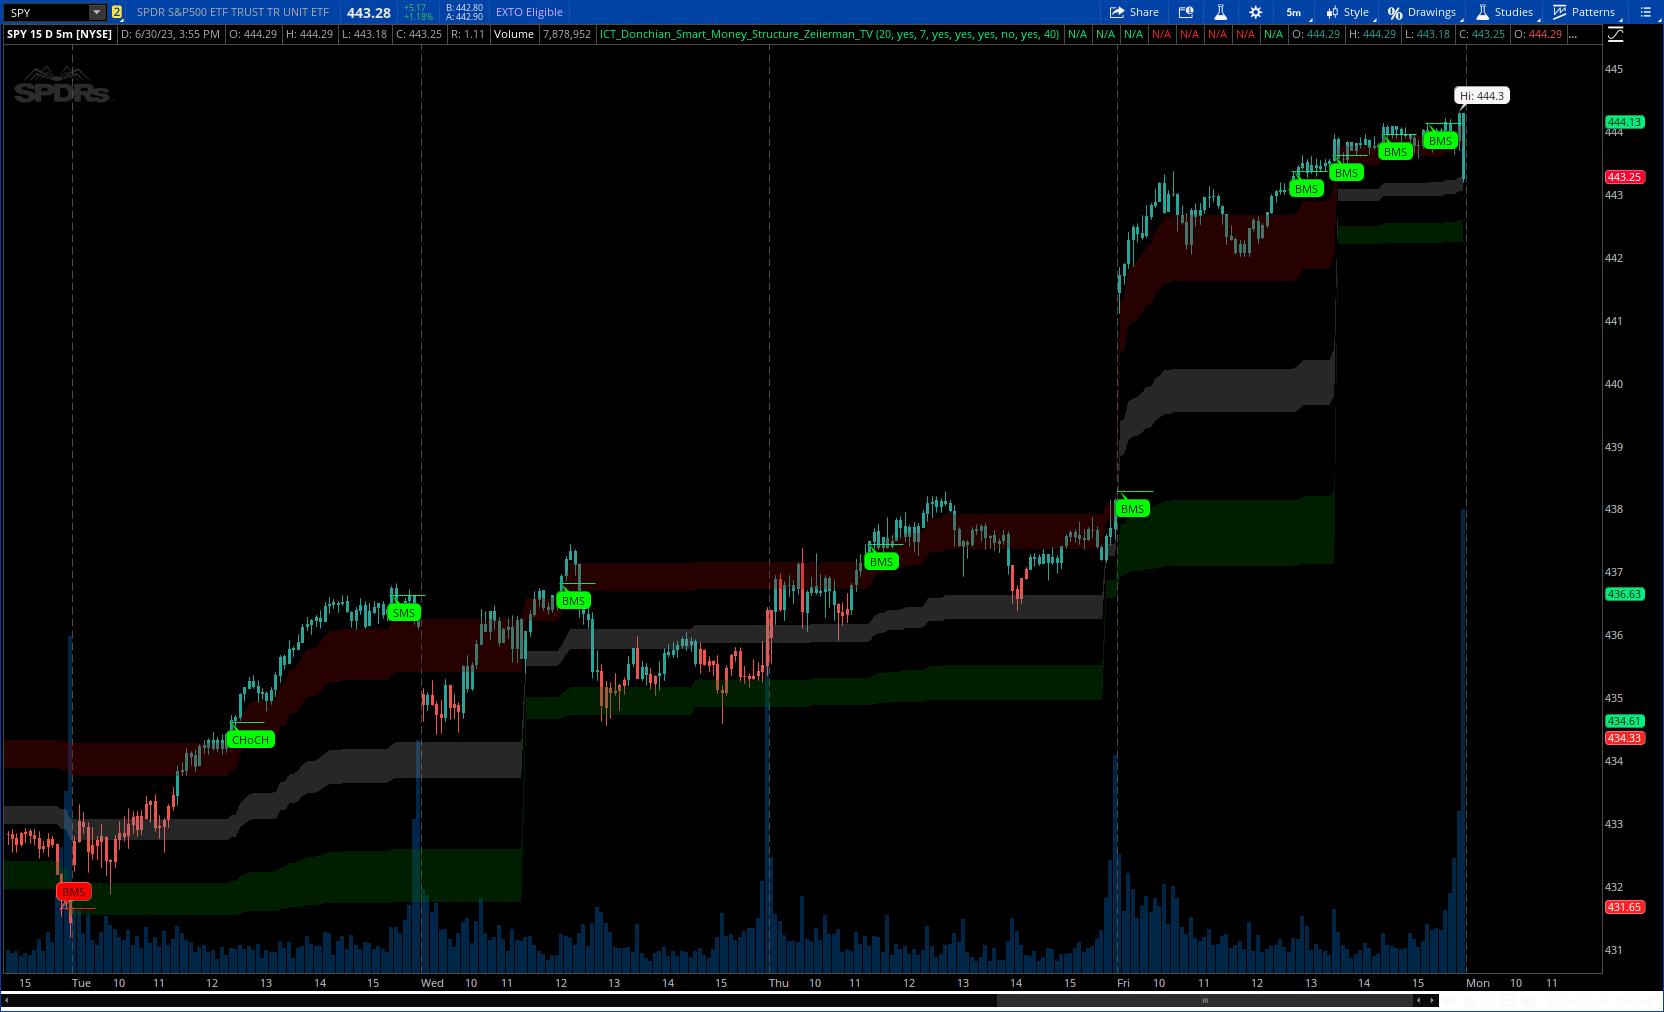
samer800 said:The Inner Circle Trader (ICT) methodology is focused on understanding the actions and implications of the so-called "smart money" - large institutions and professional traders who often influence market movements. Key to this is the concept of market structure and how it can provide insights into potential price moves.
Over time, however, there has been a notable shift in how some traders interpret and apply this methodology. Initially, it was designed with a focus on the fractal nature of markets. Fractals are recurring patterns in price action that are self-similar across different time scales, providing a nuanced and dynamic understanding of market structure.
Read more
https://usethinkscript.com/threads/ict-donchian-smart-money-structure-expo-for-thinkorswim.15966/
Last edited:

