



Scroll down to check out this week's must reads, carefully selected by uTS Moderators!

ATR Trend Average
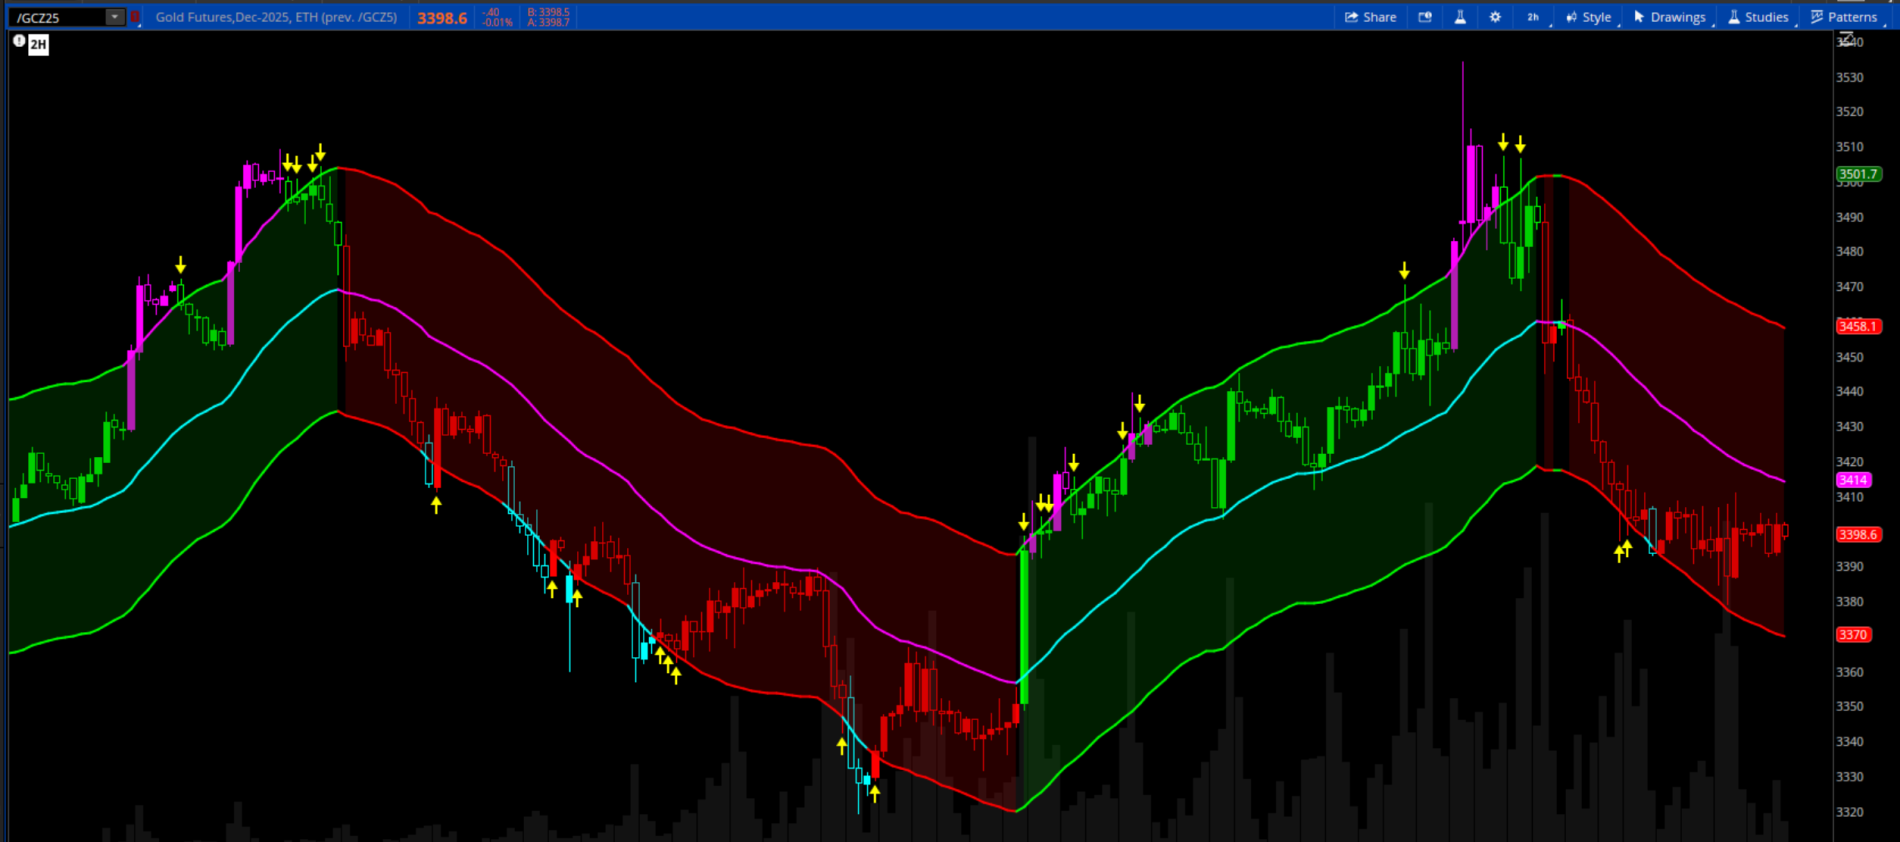
chewie76 said:If you're struggling with identifying trending markets, look no further than this ATR based trend average. This is designed to highlight reversal areas by displaying over extended price when it is beyond the bands.
When overextended, the price will be either colored magenta or cyan. Yellow arrows indicate reversals. Customize the indicator in the settings. Default is 63 EMA, but I also like the 34 EMA as well.
Read more
https://usethinkscript.com/threads/atr-trend-average-for-thinkorswim.21414/
Sentiment Pulse Indicator
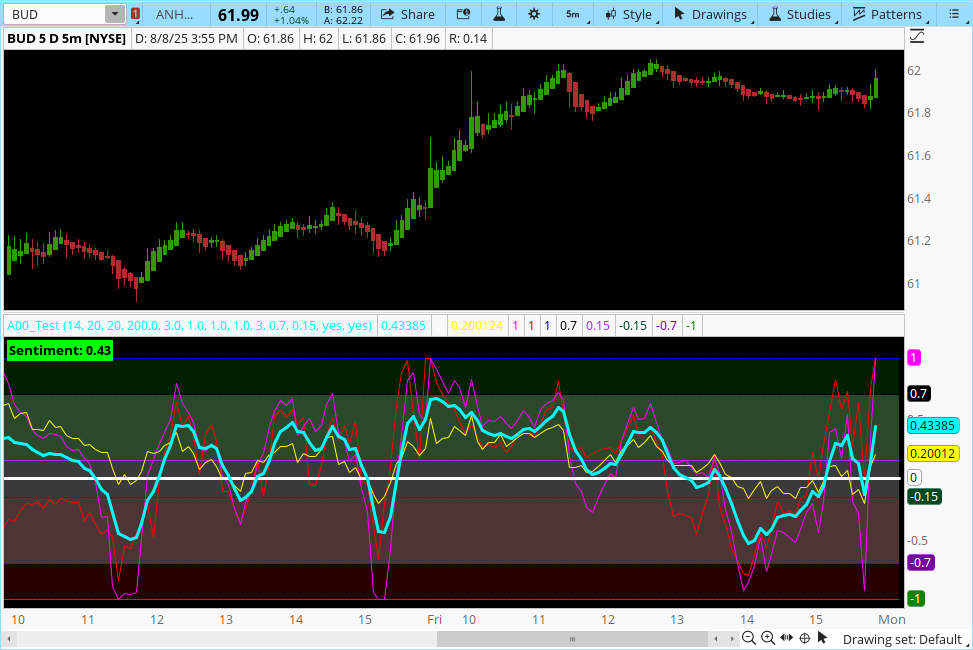
TRADERSAM said:Been working on a “Sentiment Pulse Oscillator” for a little while now and just wanted to share it with everyone. This indicator combines RSI, CCI, and OBV into one normalized reading between –1 and +1. It smooths the result, shades the background into sentiment zones, and plots vertical lines labeled “BUY” or “SELL” whenever the sentiment crosses into strong bullish or bearish alignment.
The idea is to simplify multiple indicators into a single clean view of momentum, trend, and volume pressure. It’s been working well in my testing, but I know it’s far from perfect, so I’d love any suggestions on how to make it more accurate, responsive, or visually clear.
Read more
https://usethinkscript.com/threads/sentiment-pulse-indicator-for-thinkorswim.21394/
VIP SUBSCRIBERS ONLY |
Create Sell Order Based On This Trailing Stop Analysis
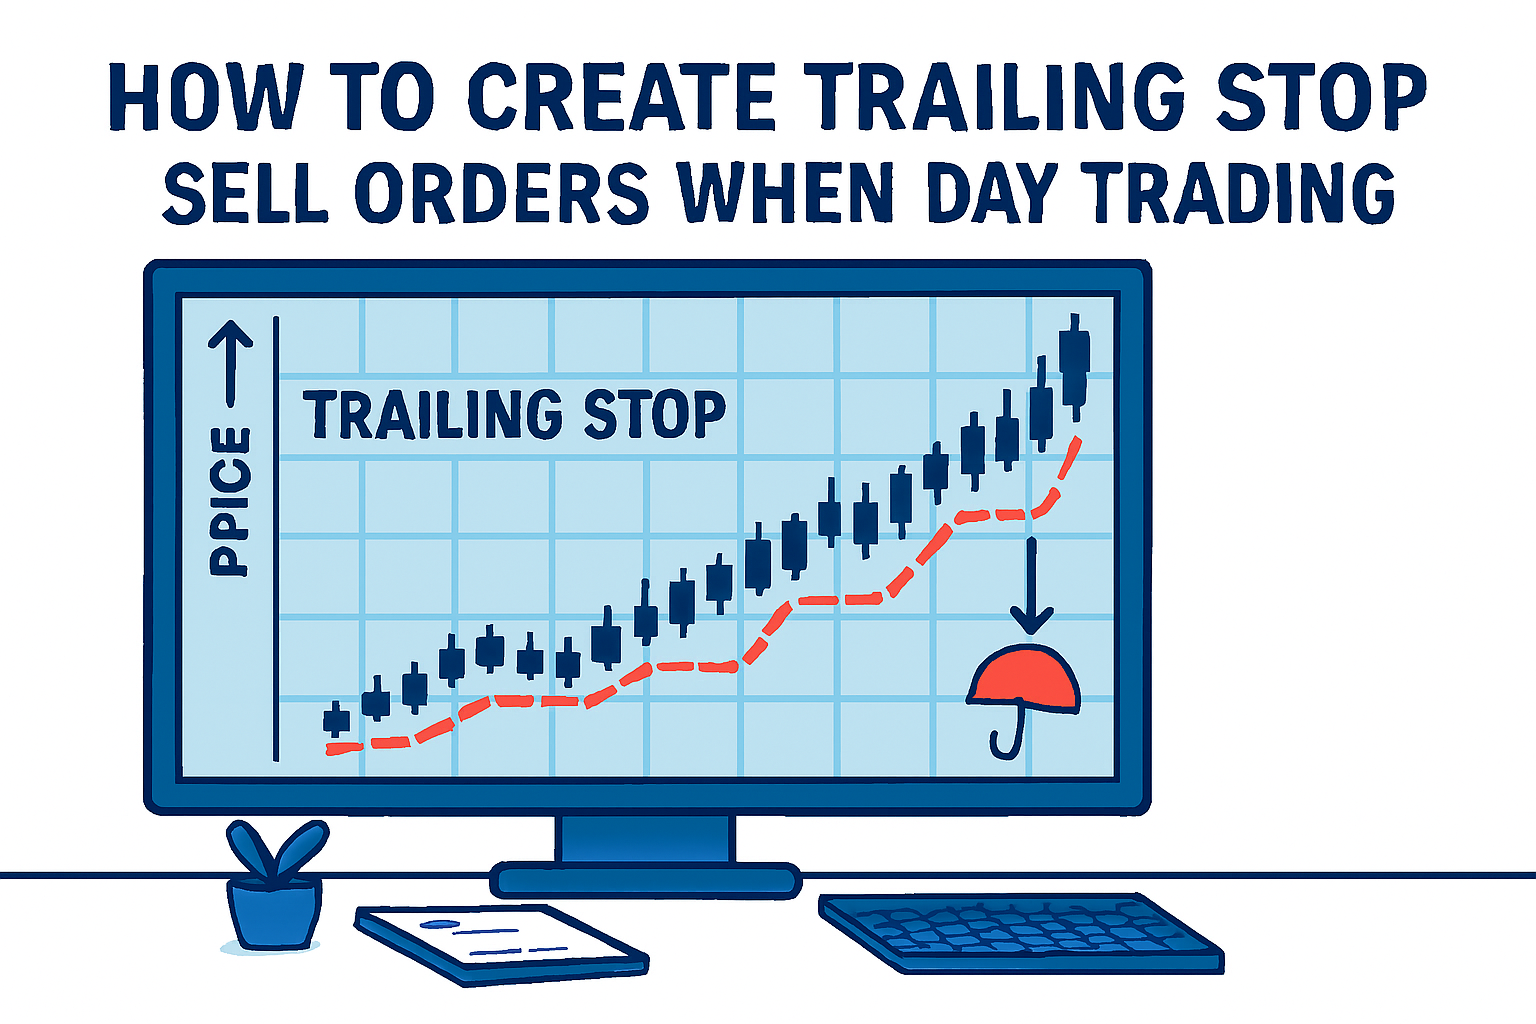
useThinkScript said:Trailing Stop Sell Orders are a simple way for day traders to set a sell order when it is not possible to keep an eagle eye on active trades.
Trailing Stop Sell Orders are best used by Trend Traders.
Mean Reversion Traders (who try to buy at the bottom) avoid using a Trailing Stop Sell Order until trend is confirmed; because price moves can be so jumpy early on, Trailing Stop Sell Order might throw them out too soon.
Here’s a simple way to set a trailing stop sell order in ThinkOrSwim...
Read more
https://usethinkscript.com/threads/...-trailing-stop-analysis-in-thinkorswim.21423/
 Unlock Thread
Join our VIP Members Club to get access to our premium indicators including Buy The Dip, Advanced Market Moves and Take Profit.
Your VIP membership includes:
✓Full access to public & private forums
✓No Ads
✓Priority community support
✓Unlimited Postings
✓Premium thinkorswim indicators
✓Exclusive strategies, scanners, add-ons
✓Discord chatroom with Trade Alerts
VIP Membership
Chande Momentum Oscillator Enhanced
antwerks said:The RSI is awesome, but the Chande Momentum Oscillator is awesomer!!! The Chande Momentum Oscillator (CMO) is a technical analysis indicator created by Tushar Chande that measures pure momentum in a security’s price, oscillating between +100 and -100.
It’s similar in spirit to RSI, but instead of comparing average gains and losses, it adds up all price changes (up and down) over a period and divides the net change by the total absolute changes — giving a percentage measure of net momentum.
In the chart below of TSLA, I have marked areas in the dashed lines of an aggressive entry/exit and solid lines a more conservative entry/exit examples using the supply and demand zones as final criterias.
Read more
https://usethinkscript.com/threads/chande-momentum-oscillator-enhanced-for-thinkorswim.21409/
FROM THE ARCHIVES |
Unusual Volume
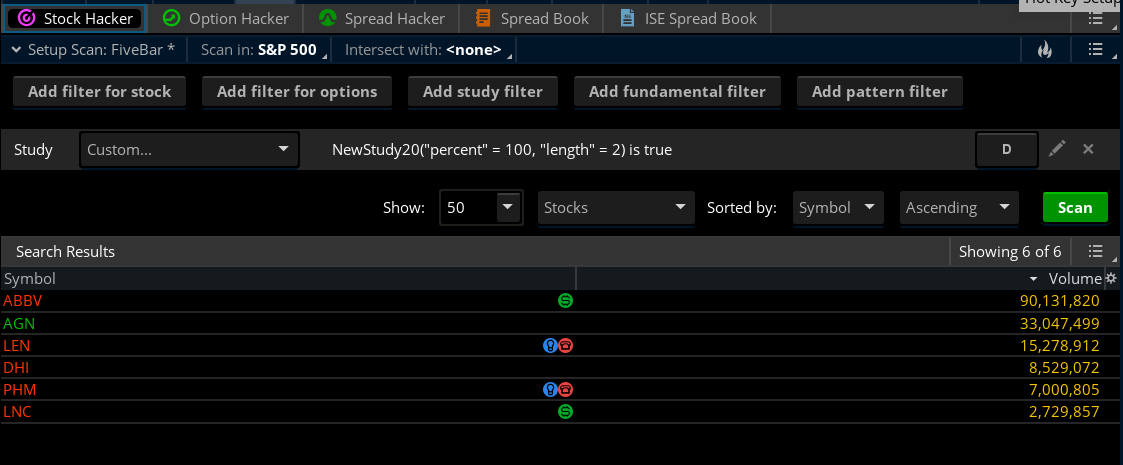
BenTen said:Here is a scanner that will help you screen for stocks with unusual volume in ThinkorSwim. When a stock suddenly increased or decreased in trading volume, that means it's being traded at an unexpectedly high level and a lot of traders often take advantage of this.
Create a new indicator in ThinkorSwim and import this code. You can add it to your chart but it won't do anything to it. Switch over to the Scan tab and look up the name of your indicator. From there you can scan for stocks that are increasing or decreasing in trading volume. You can also adjust the percentage (%) and length.
Read more
https://usethinkscript.com/threads/unusual-volume-for-thinkorswim.247/
Last edited:

