Repaints 15 min system For ThinkOrSwim

Repaints

eagle_ai

Member
The author states:
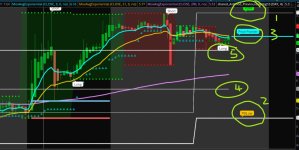
This is experimental model for 15 min chart .
first is upper and lower border in gray =upper or resistance line
black line = support line
this similar in concept to darvas box but I use instead open and close instead high and low
next is open close high and low candels in red and lime to see the opening and closure with color to direction of the trade
you can change the TF and res to anything else if you want to work with this system on different time frame
So it easy system to find where the support and resistance exist and what is the direction of trade

zJuByHN.png


Original Tradingview code
https://www.tradingview.com/script/tjWWK8Kd-15-min-system

For the new ThinkOrSwim code, you must scroll down to the next post
 
Last edited by a moderator:
https://www.tradingview.com/script/tjWWK8Kd-15-min-system

Please kindly convert this very intriguing study. Thank you.
check the below:

CSS:
# Indicator for TOS
#//@RafaelZioni=4
#study("15 min system", overlay=true)
# Converted by Sam4Cok@Samer800    - 01/2025

input tf = 60;
input resolution = AggregationPeriod.FOUR_HOURS; #("240", type=input.resolution)

def na = Double.NaN;
def last = IsNaN(close);
def cap = GetAggregationPeriod();
def hTF = Max(cap, resolution);
def isintraday = cap < AggregationPeriod.DAY;
def multiplier = cap / AggregationPeriod.MIN;
def tfM = Max(tf, multiplier);
def b = if isintraday then tfM / multiplier * 7  else 7;

script barssince {
    input cond = yes;
    def barssince = if cond then 0 else barssince[1] + 1;
    plot out = barssince;
}
script valuewhen {
    input cond = yes;
    input value = close;
    def valuewhen = if cond then value else valuewhen[1];
    plot out = valuewhen;
}

def L1 = Lowest(close, b);
def H1 = Highest(open, b);
def H2 = Highest(open, b - 1);
def H3 = Highest(open, b - 2);

def H4 = valuewhen(open > h1[1], open);
def bo = h3 < h2;
def upper = valuewhen(barssince(open > h1[1]) == b - 2 and bo, H4);
def lower = valuewhen(barssince(open > h1[1]) == b - 2 and bo, L1);

def o = if !last then open(Period = hTF)  else o[1];
def c = if !last then close(Period = hTF) else c[1];
def h = if !last then high(Period = hTF)  else h[1];
def l = if !last then low(Period = hTF)   else l[1];
def col = c >= o;
def ppo = if last then na else if b then if o >= c then h else l else o; # "Open"
def ppc = if last then na else if b then if o <= c then h else l else c; # "Close"

plot hh = if !last and b and h > c then h else na; # "High"
plot ll = if !last and b and l < c then l else na; # "Low"
plot upL = if !last and upper then upper else na;
plot loL = if !last and lower then lower else na;

hh.SetPaintingStrategy(PaintingStrategy.POINTS);
ll.SetPaintingStrategy(PaintingStrategy.POINTS);
hh.AssignValueColor(if col then Color.GREEN else Color.RED);
ll.AssignValueColor(if col then Color.GREEN else Color.RED);
upL.SetDefaultColor(Color.GRAY);
loL.SetDefaultColor(Color.GRAY);

AddCloud(ppc,  ppo,  Color.DARK_GREEN,  Color.DARK_RED);

#-- End of CODE
 
Love the idea of this indicator... really nice in trends....

I have it on a 5 min chart time frame with the resolution set to 15 min and TF to 60
setting it to 5 min chart with resolution of 30 min and TF to 60 -- does seem to help with repainting some.

What is "TF" stand for and what is its purpose ?

Problem is when there is slight consolidation .... what would need to be done with the code to keep it from flashing and repainting and going back several plots of repainting ?
 
Last edited:
What is "TF" stand for and what is its purpose ?
TF does not do much. It will adjust timeframes if a problem exists.
You can try making changes to it; report back your findings.


Problem is when there is slight consolidation .... what would need to be done with the code to keep it from flashing and repainting and going back several plots of repainting ?

This indicator and all the forum indicators with a prefix of "repaints" do actually repaint.
You will experience flashing and repainting and going back several plots of repainting.
Repainters cannot be made to not repaint.

read more:
https://usethinkscript.com/threads/answers-to-commonly-asked-questions.6006/#post-57833
 
check the below:

CSS:
# Indicator for TOS
#//@RafaelZioni=4
#study("15 min system", overlay=true)
# Converted by Sam4Cok@Samer800    - 01/2025

input tf = 60;
input resolution = AggregationPeriod.FOUR_HOURS; #("240", type=input.resolution)

def na = Double.NaN;
def last = IsNaN(close);
def cap = GetAggregationPeriod();
def hTF = Max(cap, resolution);
def isintraday = cap < AggregationPeriod.DAY;
def multiplier = cap / AggregationPeriod.MIN;
def tfM = Max(tf, multiplier);
def b = if isintraday then tfM / multiplier * 7  else 7;

script barssince {
    input cond = yes;
    def barssince = if cond then 0 else barssince[1] + 1;
    plot out = barssince;
}
script valuewhen {
    input cond = yes;
    input value = close;
    def valuewhen = if cond then value else valuewhen[1];
    plot out = valuewhen;
}

def L1 = Lowest(close, b);
def H1 = Highest(open, b);
def H2 = Highest(open, b - 1);
def H3 = Highest(open, b - 2);

def H4 = valuewhen(open > h1[1], open);
def bo = h3 < h2;
def upper = valuewhen(barssince(open > h1[1]) == b - 2 and bo, H4);
def lower = valuewhen(barssince(open > h1[1]) == b - 2 and bo, L1);

def o = if !last then open(Period = hTF)  else o[1];
def c = if !last then close(Period = hTF) else c[1];
def h = if !last then high(Period = hTF)  else h[1];
def l = if !last then low(Period = hTF)   else l[1];
def col = c >= o;
def ppo = if last then na else if b then if o >= c then h else l else o; # "Open"
def ppc = if last then na else if b then if o <= c then h else l else c; # "Close"

plot hh = if !last and b and h > c then h else na; # "High"
plot ll = if !last and b and l < c then l else na; # "Low"
plot upL = if !last and upper then upper else na;
plot loL = if !last and lower then lower else na;

hh.SetPaintingStrategy(PaintingStrategy.POINTS);
ll.SetPaintingStrategy(PaintingStrategy.POINTS);
hh.AssignValueColor(if col then Color.GREEN else Color.RED);
ll.AssignValueColor(if col then Color.GREEN else Color.RED);
upL.SetDefaultColor(Color.GRAY);
loL.SetDefaultColor(Color.GRAY);

AddCloud(ppc,  ppo,  Color.DARK_GREEN,  Color.DARK_RED);

#-- End of CODE
Is there and easy way to convert this to 5m TimeFrame? Which parameters have to be changed to what values if it could?
 
@useThinkScript , thanks, resolution setting is set to 4 hrs, do I need to make it to 5 min to use in 5 min chart?

The key to this strategy is the higher timeframe.
Higher time frames are crucial to day traders for identifying support, resistance, and trade direction.
Which is why all profitable strategies utilize multiple timeframes.
read more:
https://usethinkscript.com/threads/best-time-frame-for-trading-for-thinkorswim.12209/

They offer a broader view of market trends and key price levels where significant buying or selling occurs.

Support and resistance from higher time frames are more reliable as they reflect critical areas recognized by institutional traders and the broader market, acting as psychological barriers.

These time frames also filter out noise and false signals from lower time frames, making it easier to spot trends and determine whether the market is moving up, down, or sideways. Once the bigger picture is clear, price action on your 5-min chart can be used for precise trade setups.

You can experiment:
one 4-hr candle on a 15-min chart is represented by 16 bars
16 bars on a 5-min chart would be best represented by the 2-hr timeframe.

This is called the 15-min strategy because 15-min is the lowest timeframe considered optimal for trend trading.

Lower than 10-min, introduces chaotic price movements and noise, which are not conducive for this strategy.
And the repainting will lead to giving back profits or losses, especially in the current volatile markets.

Results do vary, of course. Do come back and report your results.
 
Last edited by a moderator:

Join useThinkScript to post your question to a community of 21,000+ developers and traders.

Similar threads

Not the exact question you're looking for?

Start a new thread and receive assistance from our community.

87k+ Posts
316 Online
Create Post

Similar threads

Similar threads

The Market Trading Game Changer

Join 2,500+ subscribers inside the useThinkScript VIP Membership Club
  • Exclusive indicators
  • Proven strategies & setups
  • Private Discord community
  • ‘Buy The Dip’ signal alerts
  • Exclusive members-only content
  • Add-ons and resources
  • 1 full year of unlimited support

Frequently Asked Questions

What is useThinkScript?

useThinkScript is the #1 community of stock market investors using indicators and other tools to power their trading strategies. Traders of all skill levels use our forums to learn about scripting and indicators, help each other, and discover new ways to gain an edge in the markets.

How do I get started?

We get it. Our forum can be intimidating, if not overwhelming. With thousands of topics, tens of thousands of posts, our community has created an incredibly deep knowledge base for stock traders. No one can ever exhaust every resource provided on our site.

If you are new, or just looking for guidance, here are some helpful links to get you started.

What are the benefits of VIP Membership?
VIP members get exclusive access to these proven and tested premium indicators: Buy the Dip, Advanced Market Moves 2.0, Take Profit, and Volatility Trading Range. In addition, VIP members get access to over 50 VIP-only custom indicators, add-ons, and strategies, private VIP-only forums, private Discord channel to discuss trades and strategies in real-time, customer support, trade alerts, and much more. Learn all about VIP membership here.
How can I access the premium indicators?
To access the premium indicators, which are plug and play ready, sign up for VIP membership here.
Back
Top