The author states:
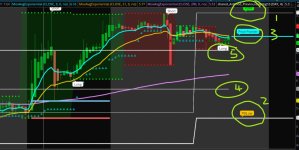
This is experimental model for 15 min chart .
first is upper and lower border in gray =upper or resistance line
black line = support line
this similar in concept to darvas box but I use instead open and close instead high and low
next is open close high and low candels in red and lime to see the opening and closure with color to direction of the trade
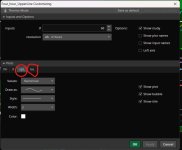
you can change the TF and res to anything else if you want to work with this system on different time frame
So it easy system to find where the support and resistance exist and what is the direction of trade

Original Tradingview code
https://www.tradingview.com/script/tjWWK8Kd-15-min-system
For the new ThinkOrSwim code, you must scroll down to the next post
This is experimental model for 15 min chart .
first is upper and lower border in gray =upper or resistance line
black line = support line
this similar in concept to darvas box but I use instead open and close instead high and low
next is open close high and low candels in red and lime to see the opening and closure with color to direction of the trade
you can change the TF and res to anything else if you want to work with this system on different time frame
So it easy system to find where the support and resistance exist and what is the direction of trade

Original Tradingview code
https://www.tradingview.com/script/tjWWK8Kd-15-min-system
For the new ThinkOrSwim code, you must scroll down to the next post
Last edited by a moderator:


