
AddChartBubble in thinkScript can replace your boring up and down arrow signals with chart bubbles filled with custom text and color. You can also assign a bubble to a particular location on your chart when a specified condition is true.
Here is another example where we plot a static line for the previous day's high and then use AddChartBubble to label it.
The only problem here is that the script above plots the bubble in every candle on your chart. Since we only have a static line, it would be better to limit the number of bubbles to one.
--------------------------------------------------------------------------------
Most of us who have endeavored to use and understand the addChartBubble() function have seen this portion of the thinkorswim Learning Center Reference Guide.
But what does that mean for the addChartBubble() function? Patience young Padawan all will become clear.
The syntax of the addChartBubble() function is unforgiving. As is the syntax of every thinkScript function. Stray from it and you will get gibberish, or nothing at all. The syntax for the addChartBubble() function is as follows:
Boolean time condition is the first of the five inputs of the addChartBubble() function. Think of it as the input that instructs thinkScript where to paint your bubble on the horizontal (left right) axis. This is the x-axis and will be referred to as such from this point forward. But in addition to providing an x-axis location, thinkScript will view this input as a boolean input (0 or not zero) (on or off) as well. More on that later though.
Let's begin as boredom likely looms. Consider what one may think would be the simplest addChartBubble() script possible;
That should be simple enough. Right?
Oops.. That didn’t work. Maybe we need a 0 rather than a 1 as the first input?
That’s worse. Now we have no bubbles at all. The addLabel in the upper left hand corner of the chart has been added to identify the exact syntax of the addChartBubble() function which thinkScript is painting.
So why with 1 as the first input does thinkScript paint a label at every close, and with the first input a 0 does it not paint at all? Recall the syntax, the term "boolean time condition". And just as importantly recall that thinkScript operates on bars from left to right. So why does thinkScript paint a bubble at the close of every bar when the boolean time condition is 1? Because as thinkScript reads your code, it simply sees yes ( 1 is "yes" in boolean) paint a bubble at this bar (x-axis) at the close of this bar (y-axis) and have the bubble contain text reading "Simple Bubble".
And why does the 0 as the boolean time condition paint no bubbles at all? Because on each bar on which thinkScript executes the script, from left to right, the input of 0 (no in boolean) tells thinkScript not to paint a bubble at that bar (x-axis location).
Let's take this boolean thing to the next level shall we? In our first example above
painted a bubble at every close. Let's explore what happens when we use 0 as the second input, the input for double price location.
Will thinkScript paint bubbles? Is the double price location boolean as well?
Interesting! Maybe the y-axis input, the double price location isn't boolean at all. Maybe its just the y-axis value on which the bubble should be painted. One more example should tell us.
Will thinkScript paint bubbles everywhere? Or will thinkscript simply move the collection of bubbles above from a y-axis value of 0 to a y-axis value of 1?
Clearly the y-axis input, the double price location is not boolean. But let's see what happens if we enter a floating point number such as 100.5 rather than an integer such as 1 or 100.
I think by now you have figured out that a double price location means it will take a floating point number.
And last but not least, just to beat this topic to death
Lesson 2
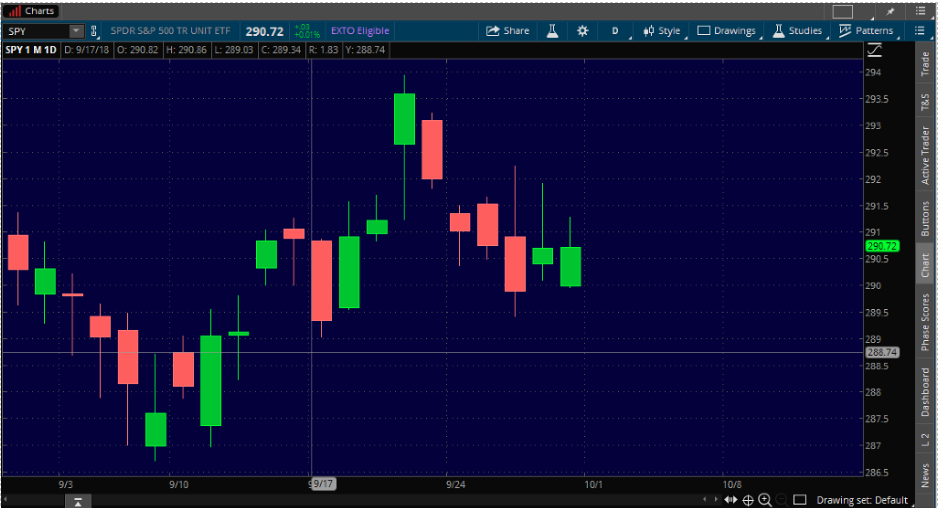
Let me share the first of a number of hints that will make your training easier. When composing an addChartBubble focus on the x-axis first by fool proofing the other two required inputs, the y-axis and the text. How? Consider the chart immediately below.
So what exactly did I mean by fool proofing? Let's consider the syntax.
The "Simple Text" input is already foolproof. So lets think about the y-axis input. Open or Close would likely come to mind first but what about that expansion area? What if you err in structuring your script and your x-axis entry places the bubble in the expansion area? Those virtual bars have no opens or closes. So we need something more foolproof. And what could be more fool proof than an integer with a value somewhere close to the most recent close. Something which we could easily see on the chart. Which leads us to a starting place such as this;
So with that simple script as our foundation, you are ready to complete the task put to you at the beginning of the 1st Exercise. Instructing thinkScript to paint an addChartBubble on that first bar and on that first bar only. But how to instruct thinkScript to do as you wish? What function or collections of functions might do the job? Functions dealing with bars perhaps? Perhaps the most direct choice might be.
Oh how I wish these References were written with students rather than the authors in mind. But such are the trials of the Padawan. How about this as a first try? It looks like want we want. We want thinkScript to paint the addChartBubble at the first bar (x-axis) at a value of 289 (y-axis).
Continue reading this guide by clicking on this link.
BubbleWithDateAndPrice_Nube [source]
Print quotes [source]
A double apostrophe inside double quotes ("''") prints a quote. Can also be combined with text e.g. "''RSI:''" produces "RSI:"
Usage
Ruby:
AddChartBubble (condition, location, custom text, custom color, boolean up);Example
The script below shows bubbles with custom text for bullish and bearish price moving average crossover.
Ruby:
#
# TD Ameritrade IP Company, Inc. (c) 2017-2020
#

input price = close;
input length = 100;
input displace = 0;

plot SMA = Average(price[-displace], length);
plot UpSignal = price crosses above SMA;
plot DownSignal = price crosses below SMA;

SMA.SetDefaultColor(GetColor(1));
AddChartBubble(UpSignal, low, "Bullish", Color.light_green, no);
AddChartBubble(DownSignal, high, "Bearish", Color.light_red, no);
Here is another example where we plot a static line for the previous day's high and then use AddChartBubble to label it.
Ruby:
input aggregationPeriod = AggregationPeriod.DAY;
def yesterday_high = high(period = aggregationPeriod)[1];

plot static = yesterday_high;
static.AssignValueColor(color.white);
AddChartBubble(static, high, "Previous day high", Color.white, no);
The only problem here is that the script above plots the bubble in every candle on your chart. Since we only have a static line, it would be better to limit the number of bubbles to one.
Ruby:
input aggregationPeriod = AggregationPeriod.DAY;
def yesterday_high = high(period = aggregationPeriod)[1];

plot static = yesterday_high;
static.AssignValueColor(color.white);

def limit = !IsNaN(close) and IsNaN(close [-1] ) && HighestAll(BarNumber());

AddChartBubble(limit, static, "Previous day high", Color.RED);
Additional scripts related to AddChartBubble
- https://usethinkscript.com/threads/addchartbubble-on-10-ema.1498/
- https://usethinkscript.com/threads/relocate-addchartbubble-for-macd-and-sma.1424/
- https://usethinkscript.com/threads/addchartbubble-trying-to-hide-certain-volume-bubbles.2593/
- https://usethinkscript.com/threads/addchartbubble-at-a-specific-time.3297/
Padawan's Guide to AddChartBubble()
I found this in the thinkScript Archive. It walks you through the AddChartBubble syntax and its usages.--------------------------------------------------------------------------------
Most of us who have endeavored to use and understand the addChartBubble() function have seen this portion of the thinkorswim Learning Center Reference Guide.
But what does that mean for the addChartBubble() function? Patience young Padawan all will become clear.
The syntax of the addChartBubble() function is unforgiving. As is the syntax of every thinkScript function. Stray from it and you will get gibberish, or nothing at all. The syntax for the addChartBubble() function is as follows:
Code:
AddChartBubble (boolean time condition,
double price location,  any text,  customColor color,  boolean up);    # CustomColor color and boolean up are not required inputs.
Boolean time condition is the first of the five inputs of the addChartBubble() function. Think of it as the input that instructs thinkScript where to paint your bubble on the horizontal (left right) axis. This is the x-axis and will be referred to as such from this point forward. But in addition to providing an x-axis location, thinkScript will view this input as a boolean input (0 or not zero) (on or off) as well. More on that later though.
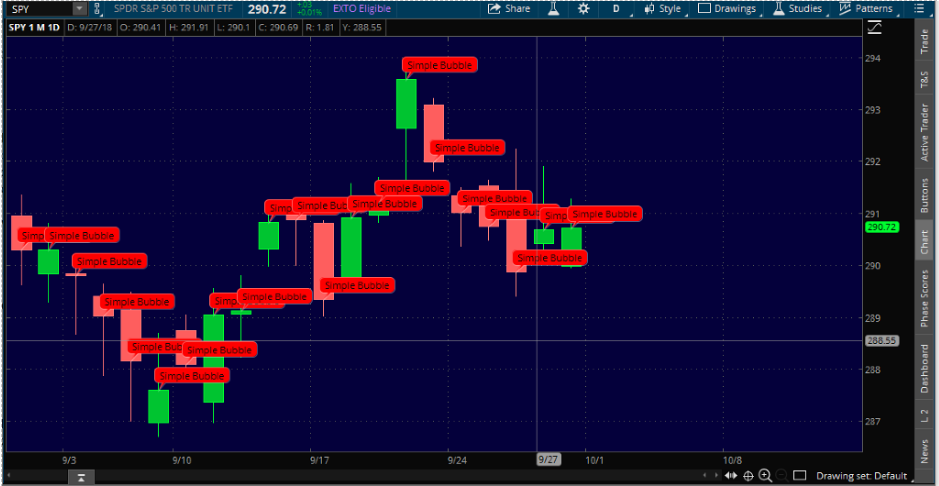
Let's begin as boredom likely looms. Consider what one may think would be the simplest addChartBubble() script possible;
Code:
addChartBubble(1, close, "Simple Bubble");
# our goal is to paint a bubble at the first bar (x-axis)
# and in particular the level of its close (y-axis)
# with the bubble text being "Simple Bubble"
That should be simple enough. Right?
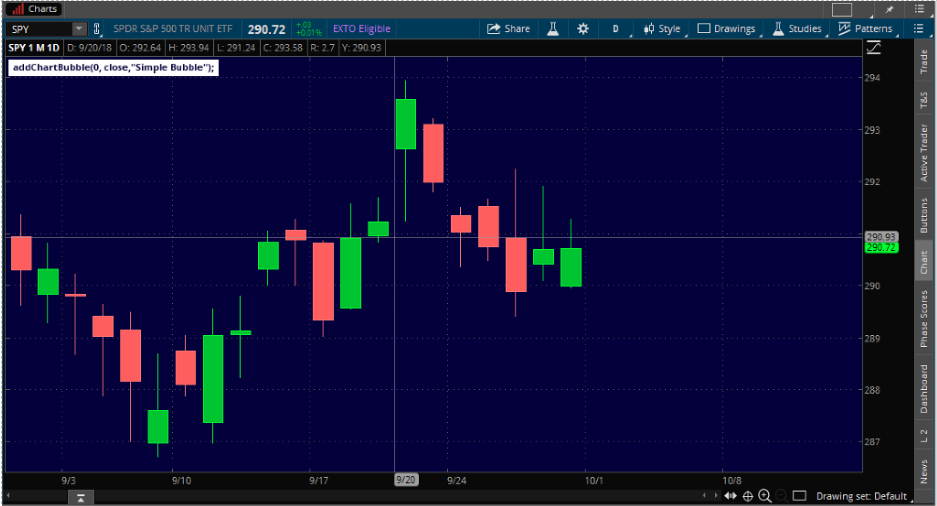
Oops.. That didn’t work. Maybe we need a 0 rather than a 1 as the first input?
That’s worse. Now we have no bubbles at all. The addLabel in the upper left hand corner of the chart has been added to identify the exact syntax of the addChartBubble() function which thinkScript is painting.
So why with 1 as the first input does thinkScript paint a label at every close, and with the first input a 0 does it not paint at all? Recall the syntax, the term "boolean time condition". And just as importantly recall that thinkScript operates on bars from left to right. So why does thinkScript paint a bubble at the close of every bar when the boolean time condition is 1? Because as thinkScript reads your code, it simply sees yes ( 1 is "yes" in boolean) paint a bubble at this bar (x-axis) at the close of this bar (y-axis) and have the bubble contain text reading "Simple Bubble".
And why does the 0 as the boolean time condition paint no bubbles at all? Because on each bar on which thinkScript executes the script, from left to right, the input of 0 (no in boolean) tells thinkScript not to paint a bubble at that bar (x-axis location).
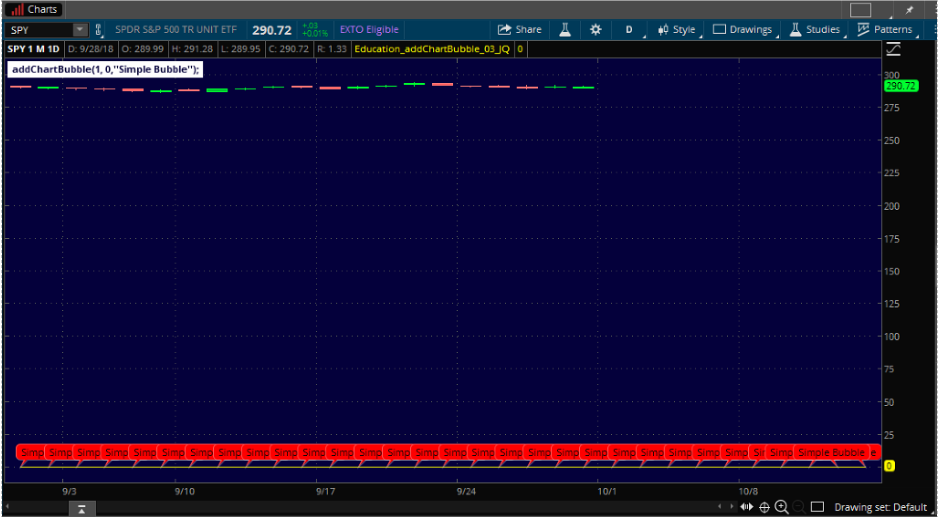
Let's take this boolean thing to the next level shall we? In our first example above
Code:
addChartBubble(1, close, "Simple Bubble");painted a bubble at every close. Let's explore what happens when we use 0 as the second input, the input for double price location.
Code:
addChartBubble(1, 0,"Simple Bubble");Will thinkScript paint bubbles? Is the double price location boolean as well?
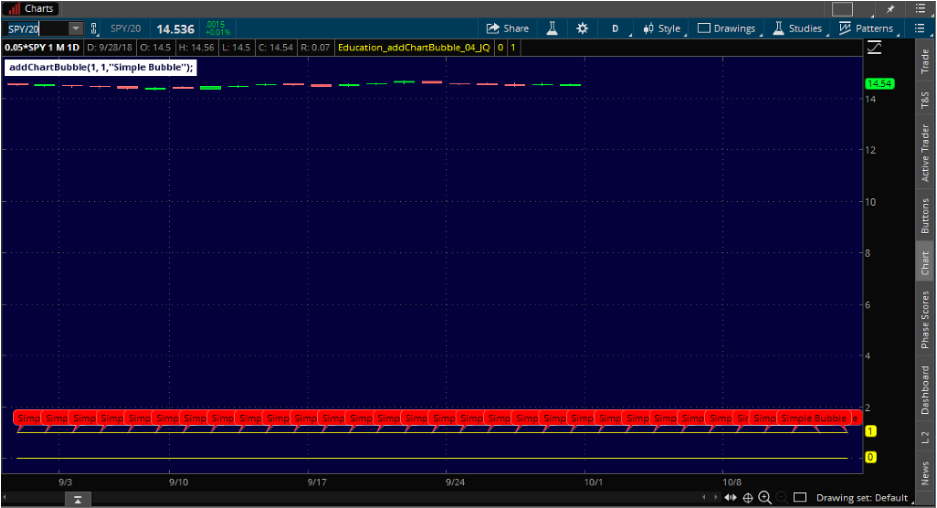
Interesting! Maybe the y-axis input, the double price location isn't boolean at all. Maybe its just the y-axis value on which the bubble should be painted. One more example should tell us.
Code:
addChartBubble(1, 1,"Simple Bubble");Will thinkScript paint bubbles everywhere? Or will thinkscript simply move the collection of bubbles above from a y-axis value of 0 to a y-axis value of 1?
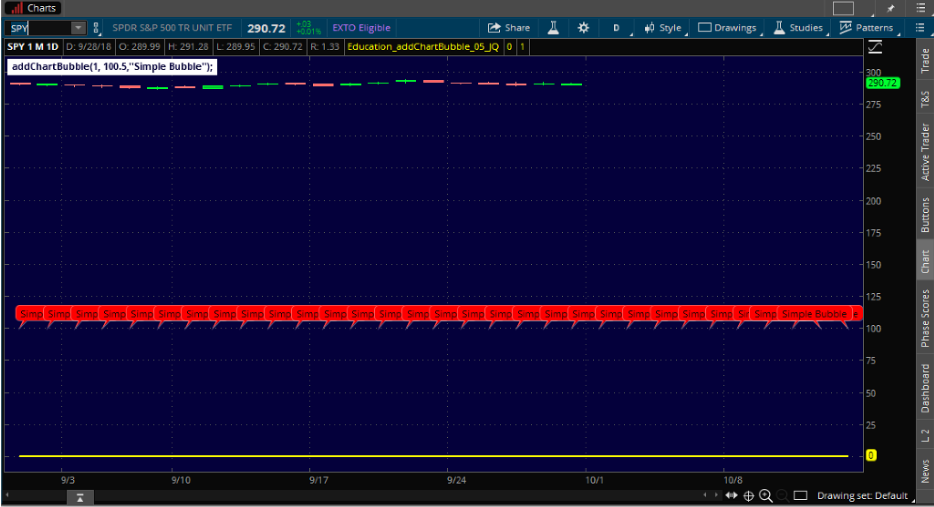
Clearly the y-axis input, the double price location is not boolean. But let's see what happens if we enter a floating point number such as 100.5 rather than an integer such as 1 or 100.
Code:
addChartBubble(1, 100.5,"Simple Bubble");I think by now you have figured out that a double price location means it will take a floating point number.
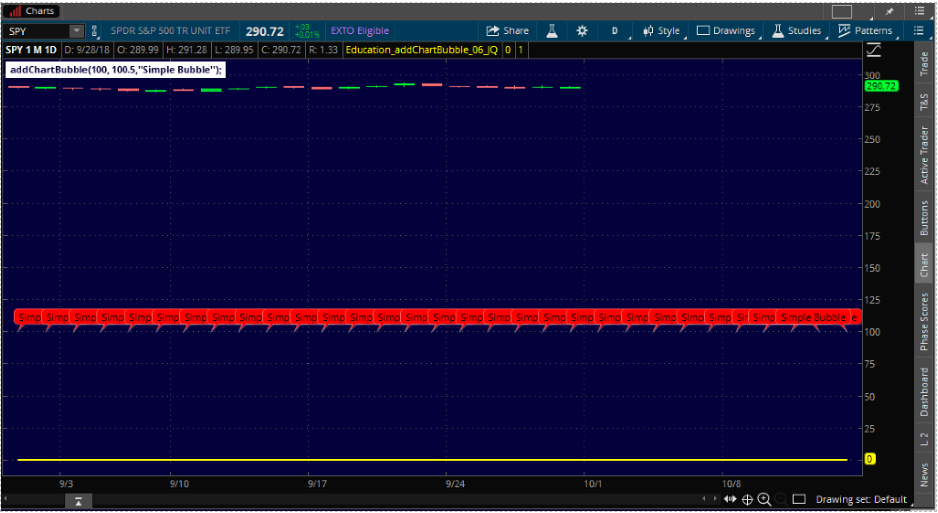
And last but not least, just to beat this topic to death
Code:
addChartBubble(100, 100.5,"Simple Bubble")Lesson 2
Let me share the first of a number of hints that will make your training easier. When composing an addChartBubble focus on the x-axis first by fool proofing the other two required inputs, the y-axis and the text. How? Consider the chart immediately below.
So what exactly did I mean by fool proofing? Let's consider the syntax.
Code:
addChartBubble(x-axis, y-axis, "Simple Text");The "Simple Text" input is already foolproof. So lets think about the y-axis input. Open or Close would likely come to mind first but what about that expansion area? What if you err in structuring your script and your x-axis entry places the bubble in the expansion area? Those virtual bars have no opens or closes. So we need something more foolproof. And what could be more fool proof than an integer with a value somewhere close to the most recent close. Something which we could easily see on the chart. Which leads us to a starting place such as this;
Code:
addChartBubble(x-axis, 289, "Simple Text");So with that simple script as our foundation, you are ready to complete the task put to you at the beginning of the 1st Exercise. Instructing thinkScript to paint an addChartBubble on that first bar and on that first bar only. But how to instruct thinkScript to do as you wish? What function or collections of functions might do the job? Functions dealing with bars perhaps? Perhaps the most direct choice might be.
Oh how I wish these References were written with students rather than the authors in mind. But such are the trials of the Padawan. How about this as a first try? It looks like want we want. We want thinkScript to paint the addChartBubble at the first bar (x-axis) at a value of 289 (y-axis).
Code:
addChartBubble(BarNumber == 1, 289, "Simple Text");Continue reading this guide by clicking on this link.
Useful Notes from the thinkScript Lounge
Bubbles at High, Low and Open on a day bar of a specific date [source]
Code:
#The code below plots bubbles at the high, low and open on a day bar of a specific date
Input SpecificDate = 20130917;# In YYYYMMDD format
Input Price = open;
def SelectedDate = getYyyyMmDd() == SpecificDate ;
AddChartBubble(SelectedDate, high, concat("", high), color.Green, yes);
AddChartBubble(SelectedDate, low, concat("", low), color.Red, no);
AddChartBubble(SelectedDate, Price, concat("", Price), color.Gray, yes);
BubbleWithDateAndPrice_Nube [source]
Code:
# BubbleWithDateAndPrice_Nube
# portions of the code from Text and Color code from StanL's treebase
# inputs

input barsBack = 0;

input price = close;

# throws an error symbol at top left of chart when condition is false. click on the error symbol to view the error message

       # condition  , "text"

assert(barsBack >= 0, "''bars back'' cannot be negative ");

    # variables

def bn = BarNumber();

def month = GetMonth();

def monthDay = GetDayOfMonth(GetYYYYMMDD());

def currentBar = HighestAll(if  !IsNaN(price)

                            then bn

                            else Double.NaN);

# StanL Bubble

                  # X Axis                , Y axis

AddChartBubble(bn == currentBar - barsBack, price,

# This section for text

"Date: " + month + "/" + monthday + (

if    price == close

then  " Close: $"

else  if    price == open

      then  " Open: $"

      else  if    price == low

            then  " Low: $"

            else  if    price == high

                  then  " High: $"

                  else  if    price == OHLC4

                        then  " OHLC4 $"

                        else  if    price == HLC3

                              then  " HLC3 $"

                              else  " Value:  " )+ price,(

# this section for color

if    price == close

then  color.cyan

else  if    price == open

      then  color.pink

      else  if    price == low

            then  color.yellow

            else  if price == high

                  then  Color.White

                  else  if    price == OHLC4

                        then  Color.Dark_Orange

                        else  if    price == HLC3

                              then  Color.Magenta

                              else  color.Plum), yes);
Print quotes [source]
A double apostrophe inside double quotes ("''") prints a quote. Can also be combined with text e.g. "''RSI:''" produces "RSI:"
Code:
addlabel (yes,"AddChartBubble(!IsNaN(close[12]) and IsNaN(close[11]), Low[12] - .5,'' my_bubble '', Color.CYAN, no);", color.WHITE);

AddChartBubble(!IsNaN(close[12]) and IsNaN(close[11]), Low[12] - .5, " '' A double apostrophe inside double quotes prints a quote. '' ", Color.CYAN, no);