BUY SELL VOLUME WITH AVERAGES AND PERCENTAGES
Code:
################################
# Original script by Cwparker23#
################################
# Original script by Cwparker23 #
#-----------------
#DISCLAIMER
#-----------------
#I am not a certified financial advisor. The content of this page/site and tools are for informational purposes only and does not constitute financial or legal advice. Under no circumstances will the author be responsible for errors or use of this tool and site. User assumes all risks.
declare lower;
declare zerobase;
def O = open;
def H = high;
def C = close;
def L = low;
def V = volume;
DEF VOLAVG= expaverage (V);
#############################################
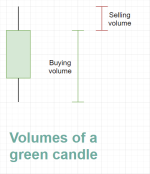
def buying = ((C - L) / (H - L))*volume;
def selling = ((H - C) / (H - L)*volume);
DEF buying_AVG= expaverage (buying);
DEF selling_AVG= expaverage (selling);
AddLabel(yes, "BAR: " + volume, Color.WHITE);
def buy_percentage = (buying_AVG/VOLAVG)*100;
AddLabel (yes, "BUY_VOL " + Round (buying , 2) + " BUY_AVG " + round (buying_AVG)+ " %" + round (buy_percentage) + "", (if buying_AVG > selling_AVG then Color.GREEN else if buying_AVG < selling_AVG then Color.GRAY else Color.YELLOW));
def SELL_percentage = (selling_AVG/VOLAVG)*100;
AddLabel (yes, "SELL_VOL " + Round (selling , 2) + " SELL_AVG " + round (selling_AVG)+ " %" + round (SELL_percentage) + "", (if buying_AVG < selling_AVG then Color.RED else if buying_AVG > selling_AVG then Color.GRAY else Color.YELLOW));