
Hey guys. I have been working on this strategy for the last few months. It's not perfect but it works for me. It takes advantage of overbought/oversold situations during a trend. This strategy will not be accurate when the trend is reversing or choppy. My goal was to find a way of entering and exiting trades fairly easy. I just want to look at a chart and make a trade (I know that's impossible but that was my goal)
When developing this strategy I was looking for something that will work on both mobile and desktop platforms so every indicator I use is built-in licensed thinkorswim indicators except one in which I found a suitable replacement for mobile.
Moving Average Cloud(platform) or MovAvgTwoLines: (I actually got the cloud from Hahn-tech. basic setup using 20/50 ema. Use same 20/50 for MovAvgTwoLine)
MacdHistogram: I only use the histogram as it is easier to read than traditional with lines. Settings: 200/400/9. This might seem a bit unusual to have such high periods using macd but I was using a MTF version of Macd and found these settings replicate higher time frames on both desktop and mobile.
Instruments traded: Any
Time frame any but the higher the time the better the results
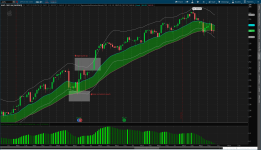
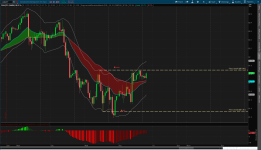
Sell: We take a sell when we have a strong downtrend by the MACD and Moving Average Cloud both showing red. We enter right when we get a touch or trade through the top band.
I use the opposite band as a potential take profit or if I am trading options, an OTM trade target. In strong trends what usually happens is that when the price hits the opposite band it can ride it higher so sometimes sit in the trade longer.
*There is only so long you can ride a trend so the first two setups are usually the best, anything after, use more scrutiny.
That's it. Super simple and yet in the right conditions very powerful.
Here are 3 examples on different instruments on different time frames.


Once again this is not perfect I do get false signals in entries when trend changes. Also I get positive signals when the macd and cloud are not synched in color (green/red)
Hope this can help others and would love for any feedback. Remember this strategy also can be used on mobile with the same results just no cloud but two moving avgs.
Here is my workspace in case anyone wants to try it.
https://tos.mx/gjvTkPC
When developing this strategy I was looking for something that will work on both mobile and desktop platforms so every indicator I use is built-in licensed thinkorswim indicators except one in which I found a suitable replacement for mobile.
Indicators used:
Exponential Deviation Bands, settings (simple moving average, 100 periods, -2,2 deviations)Moving Average Cloud(platform) or MovAvgTwoLines: (I actually got the cloud from Hahn-tech. basic setup using 20/50 ema. Use same 20/50 for MovAvgTwoLine)
MacdHistogram: I only use the histogram as it is easier to read than traditional with lines. Settings: 200/400/9. This might seem a bit unusual to have such high periods using macd but I was using a MTF version of Macd and found these settings replicate higher time frames on both desktop and mobile.
Instruments traded: Any
Time frame any but the higher the time the better the results
The setup:
Buy: We take a buy when we have a strong uptrend noted by our MACD and Moving Average cloud both showing green. We enter right when we get a touch or trade through the bottom band.Sell: We take a sell when we have a strong downtrend by the MACD and Moving Average Cloud both showing red. We enter right when we get a touch or trade through the top band.
I use the opposite band as a potential take profit or if I am trading options, an OTM trade target. In strong trends what usually happens is that when the price hits the opposite band it can ride it higher so sometimes sit in the trade longer.
*There is only so long you can ride a trend so the first two setups are usually the best, anything after, use more scrutiny.
That's it. Super simple and yet in the right conditions very powerful.
Here are 3 examples on different instruments on different time frames.
Once again this is not perfect I do get false signals in entries when trend changes. Also I get positive signals when the macd and cloud are not synched in color (green/red)
Hope this can help others and would love for any feedback. Remember this strategy also can be used on mobile with the same results just no cloud but two moving avgs.
Here is my workspace in case anyone wants to try it.
https://tos.mx/gjvTkPC
Attachments
Last edited by a moderator:
")