Combine RSI with On Balance Volume in ThinkorSwim?

Huffmac90

Member
Gents,

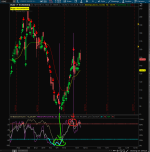
I have a complicated request for code but if it works it gives you nearly perfect entries and exits. Basis is utilizing a RSI (8, 70, 30 (green zone)) with a 20 & 80 (yellow zone) and 10 & 90 (red zone), then a Williams%r set to (8, -20,-70), and an On Balance Volume (OBV). the key is confluence and when all three touch you have a perfect entry on all time frames and when all three touch on the top quadrant you have a perfect exit. This is very similar to what you are trying to achieve but more accurate.

Ultimately, I want to boil this down to a simple arrow on the chart. I've been messing with the code and can get it to show arrows but it shows arrows on all candles which doesn't help at all. Any tips, trick, or code would be awesome. (I'm really new to code [1month] [the newb], pretty experienced with trading) back testing I'm 83% accurate! (UGAZ fundamentals are killing me otherwise it would be 89%). My ultimate goal is to help veterans make a little extra scratch on the side and teach them how to trade. (Disabled Vet - Have to help my peeps)

The Triple Threat:

Code:
input length = 14;

input over_Bought = 70;

input over_Sold = 30;

input price = close;

input averageType = AverageType.WILDERS;

input showBreakoutSignals = no;


def OBV = TotalSum(Sign(close - close[1]) * volume);


def hh = Highest(high);

def ll = Lowest(low);

def WR = if hh == ll then -100 else (hh - close) / (hh - ll) * (-100);


def NetChgAvg = MovingAverage(averageType, price - price[1], length);

def TotChgAvg = MovingAverage(averageType, AbsValue(price - price[1]), length);

def ChgRatio = if TotChgAvg != 0 then NetChgAvg / TotChgAvg else 0;

def RSI = 50 * (ChgRatio + 1);


def runup = if ((RSI and WR >= Over_sold) and OBV >=-80) then 1 else 0 ;

def rundown = if ((RSI and WR >= Over_bought) and OBV >=-20) then 1 else 0 ;


plot Above = runup;

Above.SetDefaultColor(Color.GREEN);

Above.SetPaintingStrategy(PaintingStrategy.BOOLEAN_ARROW_UP);

plot Below = rundown;

Below.SetDefaultColor(Color.RED);

Below.SetPaintingStrategy(PaintingStrategy.BOOLEAN_ARROW_DOWN);
 
Last edited:
In the picture I just sent you'll see purple lines on the candle chart that perfectly lines up with the overlap. I've circled the buy in green and the sell in red. I have a theory of why this works but that's a little long for this. I want to get the arrow to be more specific on the candle chart so I can declutter my chart. I also use the volatility box script that was posted here as a visual to give me my upper and lower limits. (I left it out so you guys can see the candles more clearly)

tbMyFEP.png
 

Attachments

  • tbMyFEP.png
    tbMyFEP.png
    114.3 KB · Views: 128
it's an interesting observation. thanks for sharing!

I think the big challenge here is the scale factor, all three indicators plot axis in different value resolution, and ToS is scaling it in the lower chart. One approach is to separate them out to 3 lower studies, then use a threshold value that you compare each relative value to build a signal. Use one of the indicators as primary (e.g. RSI or WR), and then compare it's relative value to each other, if it meets the threshold proceed, then the question is what do with the OBV and how you would represent the proper scale to complete the signal.
 
No problem, just hope the brokers don't see this! There are issues with it such as pullbacks in trend for double and triple bottoms either way, but that's what a stop loss is for. Ultimately the signal plays out but it can be nerve wracking to new traders to wait on the confirmation.

Do you have an example of a threshold value script I can mess with?

@BenTen that picture I sent is the cleanest I've gotten it. I'm looking through you trend reversal code and think maybe I can replicate it using some of your formatting (your stop-loss line)
 
Last edited by a moderator:
so taking ur idea on how to make this more systematic. maybe something like this can be turned into a system and can be coded and tested.

1. look for rsi crossing above XX within 1-2 bars (e.g. threshold period)
2. look for WR to do the same -XX within 1-2 bars
3. Simple Average of the OBV (xx periods) higher or last OBV higher within a number of bars.

reverse for short.

Let me know if you're able to test it and refine it.
 
Yeah, I'm sure it can be! It's made me a significant profit this year. Go down in the history books as the guy who hacked the stock-market! Granted I like the idea of the team that hacked the stock market better which is why I'm looking for help doing this.
 
Last edited:
Some of the defining conditions via complex scripts gets frustrating. A way around it I've used is to simply define the condition(s) and then weight them, for me, it takes some of the emotions out and helped me to see if I was judging the condition correctly.

eg, you get a bunch of conditions and weight them and then simply sum them into one number and in the range of number you can color your chart as neutral, weak buy, strong etc, so when a condition is true you get a 1 and add them up, saves a lot of screen space too
Good idea can you provide an example. Maybe you all can use this framework to code this strategy.
 
Its simple, you have your mash up of super complex scripts which yield some set of values, take RSI and OBV as an example,
def a = rsi < 30;
def b = rsi > 30 and rsi < 70;
def c = obv >50;
until all the permutations that you're interested in, leaves the script that you know works alone and ,
def buy = a+b+c;
when a or b or c is true, tos assigns a value of 1 to the condition and 0 if not true,
if a and c are true you get a value of 2, or if none are true you get 0, then just use it as a lower study, you'll see which weightings make sense and which dont, you have to play with it a bit, but thats the idea.
I've used this idea for about 50 variables and found that quite often I was over-valuing 1 script over another, for me, it saves lots of screen space and shows relationships quicker
 
I'll give it a try. OBV Is going to be a bear. I figured out how I'm going to try work OBV, an increase of decrease from the last candle.

Triple Threat round two: the arrows are still off by 3 bars and picking up a small amount of noise in the market. Also it's catching some bad data for entries and exits in half of the places. I'm going to keep working the details but if you guys have any ideas about what's going on please feel free to share!

z8HCuil.jpg


Code:
#On Balance Volume

def OBV = TotalSum(Sign(close - close[1]) * volume);

def OBV_2 = TotalSum(Sign(close - close[1]) * volume);

def OBVBullish = OBV < OBV_2;

def OBVNeutral= OBV == OBV_2;

def OBVBearish= OBV > OBV_2;

#Williams%r

declare lower;

input length = 8;

def hh = Highest(high, length);

def ll = Lowest(low, length);

def result = if hh == ll then -100 else (hh - close) / (hh - ll) * (-100);

def WR = if result > 0 then 0 else result;

def WRa = WR > -10;

def WRb = WR > -20;

def WRc = WR > -30;

def WRd = WR > -30 and WR < -70;

def WRe= WR < -70;

def WRf= WR < -80;

def WRg= WR < -90;

#RSI

input over_Bought = 70;

input over_Sold = 30;

input price = close;

input averageType = AverageType.WILDERS;

input showBreakoutSignals = no;

def NetChgAvg = MovingAverage(averageType, price - price[1], length);

def TotChgAvg = MovingAverage(averageType, AbsValue(price - price[1]), length);

def ChgRatio = if TotChgAvg != 0 then NetChgAvg / TotChgAvg else 0;

def RSI = 50 * (ChgRatio + 1);

def RSIa = RSI < 10;

def RSIb = RSI < 20;

def RSIc = RSI < 30;

def RSId = RSI > 30 and RSI < 70;

def RSIe= RSI > 70;

def RSIf= RSI > 80;

def RSIg= RSI > 90;

#Buy_Sell_Orders

def Stage_3_Buy = if (RSIc + WRc + OBVBullish) then 1 else 0 ;

def Stage_2_Buy = if  (RSIb + WRb + OBVBullish) then 1 else 0;

def Stage_1_Buy = if (RSIa + WRa + OBVBullish) then 1 else 0;

def neutral = if (RSIg + WRg + OBVNeutral) then 1 else 0;

def Stage_negone_Sell = if (RSIe + WRe + OBVBearish) then 1 else 0 ;

def Stage_negtwo_Sell = if (RSIf + WRf + OBVBearish) then 1 else 0;

def Stage_negthree_Sell = if (RSIg + WRg + OBVBearish) then 1 else 0;


#Buy Sell Arrows

def Stage_3_Buy_Arrow = Stage_3_Buy ;

def Stage_2_Buy_Arrow = Stage_2_Buy ;

def Stage_1_Buy_Arrow = Stage_1_Buy ;

def Stage_negone_Sell_Arrow = Stage_negone_Sell ;

def Stage_negtwo_Sell_Arrow = Stage_negtwo_Sell ;

def Stage_negthree_Sell_Arrow = Stage_negthree_Sell ;

plot Stage_3_Buy_Arrow3 = Stage_3_Buy > (Stage_1_Buy + Stage_2_Buy) ;

Stage_3_Buy_Arrow3.SetDefaultColor(Color.Green);

Stage_3_Buy_Arrow3.SetPaintingStrategy(PaintingStrategy.BOOLEAN_ARROW_UP);

plot Stage_2_Buy_Arrow2 = Stage_2_Buy > Stage_3_Buy  ;

Stage_2_Buy_Arrow2.SetDefaultColor(Color.Blue);

Stage_2_Buy_Arrow2.SetPaintingStrategy(PaintingStrategy.BOOLEAN_ARROW_UP);

plot Stage_1_Buy_Arrow1 = Stage_1_Buy < Stage_2_Buy   ;

Stage_1_Buy_Arrow1.SetDefaultColor(Color.Blue);

Stage_1_Buy_Arrow1.SetPaintingStrategy(PaintingStrategy.BOOLEAN_ARROW_UP);

plot Stage_negone_Sell_Arrow1 = Stage_negone_Sell > Stage_negtwo_Sell ;

Stage_negone_Sell_Arrow1.SetDefaultColor(Color.Orange);

Stage_negone_Sell_Arrow1.SetPaintingStrategy(PaintingStrategy.BOOLEAN_ARROW_DOWN);

plot Stage_negtwo_Sell_Arrow2 = Stage_negtwo_Sell > Stage_negthree_Sell  ;

Stage_negtwo_Sell_Arrow2.SetDefaultColor(Color.Yellow);

Stage_negtwo_Sell_Arrow2.SetPaintingStrategy(PaintingStrategy.BOOLEAN_ARROW_DOWN);

plot Stage_negthree_Sell_Arrow3 = Stage_negthree_Sell > ( Stage_negone_Sell + Stage_negtwo_Sell) ;

Stage_negthree_Sell_Arrow3.SetDefaultColor(Color.RED);

Stage_negthree_Sell_Arrow3.SetPaintingStrategy(PaintingStrategy.BOOLEAN_ARROW_DOWN);

I plan to add in delta from last candle to current data to maybe help fix it. Almost there gents just need to increase the restrictive parameters and it's good to go!

Also does someone have script to get the arrows to line up on the candles or do I have to add price action into the plot?
 

Attachments

  • z8HCuil.jpg
    z8HCuil.jpg
    102.2 KB · Views: 113
Last edited by a moderator:
great update - almost there. re: Boolean arrows you will need to place it up in the upper chart. you can add a sethiding condition and add an input showarrows yes/no, then you can set it to default to no, and then add the chart to the upper, and then set to yes or values as @skynetgen suggested.

quick question - what study/approach are you're using to calc the addlabel (stage) in your chart?

Are you talking about the market pulse conditions label in the upper left hand corner? If that's the case the below should work. I used a free code I found on TOS Indicators YouTube channel. I don't want to share the whole code in case their member restrictions have a legality I missed.

AddLabel (yes, if bullish then "Stage: Acceleration" else if bearish then "Stage: Deceleration" else if close >= VMA then "Stage: Accumulation" else "stage: Distribution", if bullish then Color.GREEN else if bearish then Color.RED else if close >= VMA then Color.YELLOW else Color.ORANGE);


By the way, I know someone was looking for their trademarked volatility box. Once I'm done with this code there's a few codes in the chat that are close that I'm going to borrow to replicate it. This is what I do best, take pieces that function and improve them!
 

Join useThinkScript to post your question to a community of 21,000+ developers and traders.

Similar threads

Not the exact question you're looking for?

Start a new thread and receive assistance from our community.

87k+ Posts
471 Online
Create Post

Similar threads

Similar threads

The Market Trading Game Changer

Join 2,500+ subscribers inside the useThinkScript VIP Membership Club
  • Exclusive indicators
  • Proven strategies & setups
  • Private Discord community
  • ‘Buy The Dip’ signal alerts
  • Exclusive members-only content
  • Add-ons and resources
  • 1 full year of unlimited support

Frequently Asked Questions

What is useThinkScript?

useThinkScript is the #1 community of stock market investors using indicators and other tools to power their trading strategies. Traders of all skill levels use our forums to learn about scripting and indicators, help each other, and discover new ways to gain an edge in the markets.

How do I get started?

We get it. Our forum can be intimidating, if not overwhelming. With thousands of topics, tens of thousands of posts, our community has created an incredibly deep knowledge base for stock traders. No one can ever exhaust every resource provided on our site.

If you are new, or just looking for guidance, here are some helpful links to get you started.

What are the benefits of VIP Membership?
VIP members get exclusive access to these proven and tested premium indicators: Buy the Dip, Advanced Market Moves 2.0, Take Profit, and Volatility Trading Range. In addition, VIP members get access to over 50 VIP-only custom indicators, add-ons, and strategies, private VIP-only forums, private Discord channel to discuss trades and strategies in real-time, customer support, trade alerts, and much more. Learn all about VIP membership here.
How can I access the premium indicators?
To access the premium indicators, which are plug and play ready, sign up for VIP membership here.
Back
Top