Combine RSI with On Balance Volume in ThinkorSwim?

Huffmac90

Member
Gents,

I have a complicated request for code but if it works it gives you nearly perfect entries and exits. Basis is utilizing a RSI (8, 70, 30 (green zone)) with a 20 & 80 (yellow zone) and 10 & 90 (red zone), then a Williams%r set to (8, -20,-70), and an On Balance Volume (OBV). the key is confluence and when all three touch you have a perfect entry on all time frames and when all three touch on the top quadrant you have a perfect exit. This is very similar to what you are trying to achieve but more accurate.

Ultimately, I want to boil this down to a simple arrow on the chart. I've been messing with the code and can get it to show arrows but it shows arrows on all candles which doesn't help at all. Any tips, trick, or code would be awesome. (I'm really new to code [1month] [the newb], pretty experienced with trading) back testing I'm 83% accurate! (UGAZ fundamentals are killing me otherwise it would be 89%). My ultimate goal is to help veterans make a little extra scratch on the side and teach them how to trade. (Disabled Vet - Have to help my peeps)

The Triple Threat:

Code:
input length = 14;

input over_Bought = 70;

input over_Sold = 30;

input price = close;

input averageType = AverageType.WILDERS;

input showBreakoutSignals = no;


def OBV = TotalSum(Sign(close - close[1]) * volume);


def hh = Highest(high);

def ll = Lowest(low);

def WR = if hh == ll then -100 else (hh - close) / (hh - ll) * (-100);


def NetChgAvg = MovingAverage(averageType, price - price[1], length);

def TotChgAvg = MovingAverage(averageType, AbsValue(price - price[1]), length);

def ChgRatio = if TotChgAvg != 0 then NetChgAvg / TotChgAvg else 0;

def RSI = 50 * (ChgRatio + 1);


def runup = if ((RSI and WR >= Over_sold) and OBV >=-80) then 1 else 0 ;

def rundown = if ((RSI and WR >= Over_bought) and OBV >=-20) then 1 else 0 ;


plot Above = runup;

Above.SetDefaultColor(Color.GREEN);

Above.SetPaintingStrategy(PaintingStrategy.BOOLEAN_ARROW_UP);

plot Below = rundown;

Below.SetDefaultColor(Color.RED);

Below.SetPaintingStrategy(PaintingStrategy.BOOLEAN_ARROW_DOWN);
 
Last edited:
Are you talking about the market pulse conditions label in the upper left hand corner? If that's the case the below should work. I used a free code I found on TOS Indicators YouTube channel. I don't want to share the whole code in case their member restrictions have a legality I missed.

AddLabel (yes, if bullish then "Stage: Acceleration" else if bearish then "Stage: Deceleration" else if close >= VMA then "Stage: Accumulation" else "stage: Distribution", if bullish then Color.GREEN else if bearish then Color.RED else if close >= VMA then Color.YELLOW else Color.ORANGE);


By the way, I know someone was looking for their trademarked volatility box. Once I'm done with this code there's a few codes in the chat that are close that I'm going to borrow to replicate it. This is what I do best, take pieces that function and improve them!

thanks! - if it's free and available online, you can always post it as long as it's available elsewhere, you credit the author/creator and you think others will find value ;)
 

Join useThinkScript to post your question to a community of 21,000+ developers and traders.

Gents,

Still cant get the arrows to line up with the candles but I've reduced the chop by a ton. I'm going to keep working the specifics however here is the prototype with special thanks included. @BenTen I did use a piece of your code from your latest indicator so I wanted to give you a special shout out.

If anyone has a solution for the arrows I would love to hear it.

Code:
#

# THE TRIPLE THREAT TRADING STRATEGY

# CREATED BY THE TACTICAL TRADER

# CONTRIBUTION FROM useTHINKSCRIPT

# Special thanks BenTen, DIAZLAZ, Codydog

#


#Price Action Comparison

input method = {default average, high_low};

def bubbleoffset = .0005;

def percentamount = .01;

def revAmount = .05;

def atrreversal = 2.0;

def atrlength = 5;

def pricehigh = high;

def pricelow = low;

def averagelength = 5;

input averageType = AverageType.WILDERS;

def mah = MovingAverage(averagetype, pricehigh, averagelength);

def mal = MovingAverage(averagetype, pricelow, averagelength);

def priceh = if method == method.high_low then pricehigh else mah;

def pricel = if method == method.high_low then pricelow else mal;

def EI = ZigZagHighLow("price h" = priceh, "price l" = pricel, "percentage reversal" = percentamount, "absolute reversal" = revAmount, "atr length" = atrlength, "atr reversal" = atrreversal);

def reversalAmount = if (close * percentamount / 100) > Max(revAmount < atrreversal * reference ATR(atrlength), revAmount) then (close * percentamount / 100) else if revAmount < atrreversal * reference ATR(atrlength) then atrreversal * reference ATR(atrlength) else revAmount;

rec EISave = if !IsNaN(EI) then EI else GetValue(EISave, 1);

def chg = (if EISave == priceh then priceh else pricel) - GetValue(EISave, 1);

def isUp = chg >= 0;

def isDOWN = chg <= 0;

rec isConf = AbsValue(chg) >= reversalAmount or (IsNaN(GetValue(EI, 1)) and GetValue(isConf, 1));

def EId = if isUp then 1 else 0;

def EIx = if isDOWN then 1 else 0;


#plot EnhancedLines = if EId <= 1 then EI else Double.NaN;

#EnhancedLines.AssignValueColor(if EId == 1 then Color.GREEN else if EId == 0 then Color.RED else Color.DARK_ORANGE);

#EnhancedLines.SetStyle(Curve.FIRM);

#EnhancedLines.EnableApproximation();

#EnhancedLines.HideBubble();


#Price Change between Enhanceds

def xxhigh = if EISave == priceh then priceh else xxhigh[1];

def chghigh = priceh - xxhigh[1];

def xxlow = if EISave == pricel then pricel else xxlow[1];

def chglow = pricel - xxlow[1];

def showBubbleschange = no;

AddChartBubble(showBubbleschange and !IsNaN(EI) and BarNumber() != 1, if isUp then priceh * (1 + bubbleoffset) else pricel * (1 - bubbleoffset) , "$" + chg , if isUp and chghigh > 0 then Color.GREEN else if isUp and chghigh < 0 then Color.RED else if isUp then Color.YELLOW else if !isUp and chglow > 0 then Color.GREEN else if !isUp and chglow < 0 then Color.RED else Color.YELLOW, isUp);

#Price at High/Low

def showBubblesprice = no;

AddChartBubble(showBubblesprice and !IsNaN(EI) and BarNumber() != 1, if isUp then priceh * (1 + bubbleoffset) else pricel * (1 - bubbleoffset) , if isUp then "$" + priceh else "$" + pricel , if isUp and chghigh > 0 then Color.GREEN else if isUp and chghigh < 0 then Color.RED else if isUp then Color.YELLOW else if !isUp and chglow > 0 then Color.GREEN else if !isUp and chglow < 0 then Color.RED else Color.YELLOW, isUp);


#On Balance Volume

def OBV = TotalSum(Sign(close - close[1]) * volume);

def OBV_2 = TotalSum(Sign(close - close[1]) * volume);

def OBV_3 = TotalSum(Sign(close - close[1]) * volume);

def OBVBullish = OBV < OBV_2;

def OBVNeutral = OBV == OBV_2;

def OBVBearish = OBV > OBV_2;


#Williams%r

input length = 8;

def hh = Highest(high, length);

def ll = Lowest(low, length);

def result = if hh == ll then -100 else (hh - close) / (hh - ll) * (-100);

def WR = if result > 0 then 0 else result;


def WRa = WR >= -10;

def WRb = WR >= -20;

def WRc = WR >= -30;

def WRd = ((WR <= -30) and (WR >= -70));

def WRe = WR <= -70;

def WRf = WR <= -80;

def WRg = WR <= -90;


#RSI

input over_Bought = 70;

input over_Sold = 30;

input price = close;

input showBreakoutSignals = no;


def NetChgAvg = MovingAverage(averageType, price - price[1], length);

def TotChgAvg = MovingAverage(averageType, AbsValue(price - price[1]), length);

def ChgRatio = if TotChgAvg != 0 then NetChgAvg / TotChgAvg else 0;

def RSI = 50 * (ChgRatio + 1);


def RSIa = RSI <= 10;

def RSIb = RSI <= 20;

def RSIc = RSI <= 30;

def RSId = RSI >= 30 and RSI <= 70;

def RSIe = RSI >= 70;

def RSIf = RSI >= 80;

def RSIg = RSI >= 90;


#Buy_Sell_Orders

def Stage_3_Buy = if ((RSIc > RSIb) + (WRc > WRb) + (OBVBullish > OBVBullish [1]) and chglow) then 1 else 0 ;

def Stage_2_Buy = if ((RSIb > RSIa) + (WRb > WRa) + (OBVBullish > OBVBullish[1]) and chglow) then 1 else 0;

def Stage_1_Buy = if (RSIa + WRa + (OBVBullish > OBVBullish[1]) and chglow) then 1 else 0;

def Stage_negone_Sell = if (RSIe + WRe + (OBVBearish < OBVBearish[1]) and chghigh) then 1 else 0 ;

def Stage_negtwo_Sell = if ((RSIf < RSIe) + (WRf > WRe) + (OBVBearish < OBVBearish[1]) and chghigh) then 1 else 0;

def Stage_negthree_Sell = if ((RSIg < RSIf) + (WRf > WRe) + (OBVBearish < OBVBearish[1])and chghigh) then 1 else 0;


#Buy Sell Arrows

def Stage_3_Buy_Arrow = if Stage_3_Buy > Stage_2_Buy then 1 else 0;

def Stage_2_Buy_Arrow = if Stage_2_Buy > Stage_1_Buy then 1 else 0;

def Stage_1_Buy_Arrow = Stage_1_Buy ;

def Stage_negone_Sell_Arrow = if Stage_negone_Sell < Stage_negtwo_Sell then 1 else 0 ;

def Stage_negtwo_Sell_Arrow = if Stage_negtwo_Sell < Stage_negthree_Sell then 1 else 0;

def Stage_negthree_Sell_Arrow = Stage_negthree_Sell ;

plot Stage_3_Buy_Arrow3 = Stage_3_Buy > (Stage_1_Buy + Stage_2_Buy) ;

Stage_3_Buy_Arrow3.SetDefaultColor(Color.GREEN);

Stage_3_Buy_Arrow3.SetPaintingStrategy(PaintingStrategy.BOOLEAN_ARROW_UP);

plot Stage_2_Buy_Arrow2 = Stage_2_Buy > Stage_3_Buy ;

Stage_2_Buy_Arrow2.SetDefaultColor(Color.BLUE);

Stage_2_Buy_Arrow2.SetPaintingStrategy(PaintingStrategy.BOOLEAN_ARROW_UP);

plot Stage_1_Buy_Arrow1 = Stage_1_Buy < Stage_2_Buy ;

Stage_1_Buy_Arrow1.SetDefaultColor(Color.BLUE);

Stage_1_Buy_Arrow1.SetPaintingStrategy(PaintingStrategy.BOOLEAN_ARROW_UP);

plot Stage_negone_Sell_Arrow1 = Stage_negone_Sell > Stage_negtwo_Sell ;

Stage_negone_Sell_Arrow1.SetDefaultColor(Color.ORANGE);

Stage_negone_Sell_Arrow1.SetPaintingStrategy(PaintingStrategy.BOOLEAN_ARROW_DOWN);

plot Stage_negtwo_Sell_Arrow2 = Stage_negtwo_Sell > Stage_negthree_Sell ;

Stage_negtwo_Sell_Arrow2.SetDefaultColor(Color.YELLOW);

Stage_negtwo_Sell_Arrow2.SetPaintingStrategy(PaintingStrategy.BOOLEAN_ARROW_DOWN);

plot Stage_negthree_Sell_Arrow3 = Stage_negthree_Sell > ( Stage_negone_Sell + Stage_negtwo_Sell) ;

Stage_negthree_Sell_Arrow3.SetDefaultColor(Color.RED);

Stage_negthree_Sell_Arrow3.SetPaintingStrategy(PaintingStrategy.BOOLEAN_ARROW_DOWN);
 
Last edited by a moderator:
@Huffmac90 Love the progress. Keep working on it. Will contribute where I see fit.

P.S: I notice you included ZigZag in there. Is this thing going to repaint or lag behind?
 
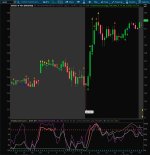
Arrows solved!! I fat fingered a value. In case anyone was wondering from the green buy signal at open to that first red candle is 7.63% profit!

z6nYgHW.jpg
 

Attachments

  • z6nYgHW.jpg
    z6nYgHW.jpg
    107.2 KB · Views: 104
Last edited:
@Huffmac90 Love the progress. Keep working on it. Will contribute where I see fit.

P.S: I notice you included ZigZag in there. Is this thing going to repaint or lag behind?

Lag is the plan. I liked the feature and it cleared a little more chop because you can see the areas where you'll get mild false signals (still need to work on getting rid if them, but where there's a will there's away!)

I think I've figured out how to reduce them! Watching a TTM Scalper alert video now to see if maybe the answer is in that code
 
@MBF Thanks, exactly what I was looking for!

Just wanted to put out a caution for this: it doesn't respond well to pot stocks and how slammed they are getting.

Finally figured out a way to incorporate the arrows I wanted utilizing a TTM_scalper re-engineer created by mobius but need to work on the timing of the arrows so it's not a re-painter. It's difficult but I know once it's done it will be a work of art!
 
Last edited by a moderator:
Its simple, you have your mash up of super complex scripts which yield some set of values, take RSI and OBV as an example,
def a = rsi < 30;
def b = rsi > 30 and rsi < 70;
def c = obv >50;
until all the permutations that you're interested in, leaves the script that you know works alone and ,
def buy = a+b+c;
when a or b or c is true, tos assigns a value of 1 to the condition and 0 if not true,
if a and c are true you get a value of 2, or if none are true you get 0, then just use it as a lower study, you'll see which weightings make sense and which dont, you have to play with it a bit, but thats the idea.
I've used this idea for about 50 variables and found that quite often I was over-valuing 1 script over another, for me, it saves lots of screen space and shows relationships quicker

...................................................................................................................................................................................................................................................................................................'

I have been trying to find a code for a stop loss trigger to add to indicators that is not ATR stop or trail. I'm not a coder so trying to learn and this is a good model for me to keep to combine conditions together, but what if I have a system with 4 conditions and if the primary condition is met/true and one of the other 3 then it's a buy how to code it? For example if primary condition A is met/true and either condition B or condition C or condition D then it's a buy. As far as what you said about TOS assigning 1 if true or 0 if false does both of these the models need a statement to say that. Thanks in advance.

An easy way to do this, could be to overweight your primary variable.

eg, you've defined a,b,c,d then

def e = a* 3;
def f = b; etc

then, def k = e + f + all your variables,

then plot buy = k >= 4; so if all your non-primary variables are true, you dont get the buy signal as 'a ' has to be tru as well

i've also done this to save space, have the color of a moving average change to reflect the values you're interested in

I'm also sure there are very talented folks here who can give you more elegant solutions. 'Coding' is just learning a foreign language and associated grammar rules, thankfully no correct pronunciation required!
 
My ultimate goal is to help veterans make a little extra scratch on the side and teach them how to trade. (Disabled Vet - Have to help my peeps)

Huff;
I'm one of your "Disabled Vets" trying to scratch. Have you any recent latest updates to Triple Threat to share? I'm intrigued by your code and setups!

Mule
 
Huff;
I'm one of your "Disabled Vets" trying to scratch. Have you any recent latest updates to Triple Threat to share? I'm intrigued by your code and setups!

Mule

I actually ended up learning supply / demand zones and created a strategy to better determine which zones will be valid. I'm working on creating recordings for this and cleaning up the code. I still manually plot the zones but the code calls them out (if I have them autoplot it covers the entire chart).
 
Have you tried Normalizing all three so that they fit onto the same scale? You can still define overbought/oversold as a fraction of 1 rather than 100.

Here's what it looks like (I used your color scheme):

BaY70f7.png


Here's the code:

Code:
# For HuffMac from UseThinkScript.com
# A custom study by Ramon DV AKA Pelonsax
# Williams %R , OBV, RSI Normalized
#


declare lower;

#Williams%R
def hh = Highest(high, 8);
def ll = Lowest(low, 8);
def result = if hh == ll then -100 else (hh - close) / (hh - ll) * (-100);
def WR = if result > 0 then 0 else result;
plot WilliamsNorm = (WR  - LowestAll(WR)) / (HighestAll(WR) - LowestAll(WR));
WilliamsNorm.SetDefaultColor(color.plum);

# OBV
def OBV = TotalSum(Sign(close - close[1]) * volume);
plot OBVNorm = (OBV  - LowestAll(OBV)) / (HighestAll(OBV) - LowestAll(OBV));
OBVNorm.SetDefaultColor(color.Yellow);
#RSI
input over_Bought = 0.7;
input over_Sold = 0.3;
plot OverSold = over_Sold;
OverSold.SetDefaultColor(Color.LIGHT_RED);
plot OverBought = over_Bought;
OverBought.SetDefaultColor(Color.LIGHT_GREEN);

def NetChgAvg = MovingAverage(AverageType.WILDERS, close - close[1], 8);
def TotChgAvg = MovingAverage(AverageType.WILDERS, AbsValue(close - close[1]), 8);
def ChgRatio = if TotChgAvg != 0 then NetChgAvg / TotChgAvg else 0;
def RSI = 50 * (ChgRatio + 1);
plot RSINorm = (RSI  - LowestAll(RSI)) / (HighestAll(RSI) - LowestAll(RSI));
RSINorm.DefineColor("OverBought", GetColor(5));
RSINorm.DefineColor("Normal", GetColor(7));
RSINorm.DefineColor("OverSold", GetColor(1));
RSINorm.AssignValueColor(if RSINorm > over_Bought then RSINorm.Color("OverBought") else if RSINorm < over_Sold then RSINorm.Color("OverSold") else RSINorm.Color("Normal"));
OverSold.SetDefaultColor(GetColor(8));
Overbought.SetDefaultColor(GetColor(8));

plot line90 = 0.9;
line90.SetDefaultColor(Color.MAGENTA);
plot line80 = 0.8;
line80.SetDefaultColor(Color.RED);
plot line70 = 0.7;

plot Line20  = 0.2;
line20.SetDefaultColor(Color.GREEN);
plot line10 = 0.1;
line10.SetDefaultColor(Color.CYAN);

Here's the link:
https://tos.mx/75PQhgL
 
@Huffmac90 can you share what your chart looks like and the strategy you have come up with please? I too like supply and demand zones and have been looking to incorporate them with other indicators to help draw the zones more accurately. Thanks for your time!
 
@Huffmac90 can you share what your chart looks like and the strategy you have come up with please? I too like supply and demand zones and have been looking to incorporate them with other indicators to help draw the zones more accurately. Thanks for your time!
@Huffmac90 Did you get the script to work finally? If so can you please share the final script. Thanks
https://usethinkscript.com/threads/...e-volume-in-thinkorswim.811/page-2#post-30157
 

Similar threads

Not the exact question you're looking for?

Start a new thread and receive assistance from our community.

87k+ Posts
510 Online
Create Post

Similar threads

Similar threads

The Market Trading Game Changer

Join 2,500+ subscribers inside the useThinkScript VIP Membership Club
  • Exclusive indicators
  • Proven strategies & setups
  • Private Discord community
  • ‘Buy The Dip’ signal alerts
  • Exclusive members-only content
  • Add-ons and resources
  • 1 full year of unlimited support

Frequently Asked Questions

What is useThinkScript?

useThinkScript is the #1 community of stock market investors using indicators and other tools to power their trading strategies. Traders of all skill levels use our forums to learn about scripting and indicators, help each other, and discover new ways to gain an edge in the markets.

How do I get started?

We get it. Our forum can be intimidating, if not overwhelming. With thousands of topics, tens of thousands of posts, our community has created an incredibly deep knowledge base for stock traders. No one can ever exhaust every resource provided on our site.

If you are new, or just looking for guidance, here are some helpful links to get you started.

What are the benefits of VIP Membership?
VIP members get exclusive access to these proven and tested premium indicators: Buy the Dip, Advanced Market Moves 2.0, Take Profit, and Volatility Trading Range. In addition, VIP members get access to over 50 VIP-only custom indicators, add-ons, and strategies, private VIP-only forums, private Discord channel to discuss trades and strategies in real-time, customer support, trade alerts, and much more. Learn all about VIP membership here.
How can I access the premium indicators?
To access the premium indicators, which are plug and play ready, sign up for VIP membership here.
Back
Top