Inverted Vix Fix with Deviation Bands for ThinkorSwim

horserider

Well-known member
VIP
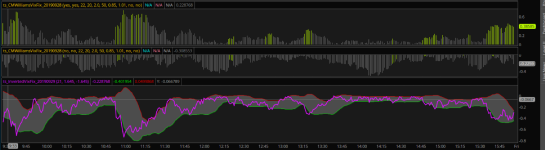
With the recent interest in Vix and Vix Fix I found a study on a forum reply. So no idea of original author. I changed the study which plotted the William's Vix Fix formula and dev. bands to an inverted plot. To me much easier to read then normal a vix type plot. Also posting for those who prefer an actual plot to interpret rather than just going off an arrow or candle color. The principles of trading bands should also work here in a more visually logical format.

Code:
# Changed the existing study, author not listed to an inverted Vix Fix.
# Changes by Horserider 9/28/2019
#
# Original study notation below:
#hint period: The number of bars used to calculate the VIX <b>(Default is 10)</b>
#hint Num_Dev_Up: The amount of stdev up. <b>(Default is 1.645</b>, 90% probability)
#hint Num_Dev_Dn: The amount of stdev down.<b>(Default is -1.645</b>, 90% probability)


declare lower;

input period = 10;
input Num_Dev_Up  = 1.645;
input Num_Dev_Dn = -1.645;


def WVF = (Highest(close, period) - low) / (Highest(close, period)) * 100;
plot inv_WVF = - WVF;
inv_WVF.HideBubble();

def sDev = stdev(data = inv_WVF, period);
def MidLine = Average(data = inv_WVF, period);

plot LowerBand = MidLine + num_Dev_Dn * sDev;
LowerBand.HideBubble();

plot UpperBand = MidLine + num_Dev_Up * sDev;
UpperBand.HideBubble();

LowerBand.SetDefaultColor(CreateColor(0, 224, 0));
inv_WVF.SetDefaultColor(CreateColor(221, 18, 255));
inv_WVF.SetLineWeight(2);
UpperBand.SetDefaultColor(CreateColor(224, 0, 0));

AddCloud(UpperBand, LowerBand, Color.LIGHT_GRAY);

ZlpkGI8.jpg


Just finished the study and played a bit with inputs on 5 Min and 55 period looked good. Feel free to play with inputs and please share any great ones you find.
 
Last edited:
@horserider cool stuff - i'm also playing around with it. seems like it has good potential and could be purpose for a number of different ways.

jswQkxf.png


Overlaying with it on a 21 period on a 1 minute chart (currently focus on 1mins and 5 mins, I need to move up to higher time frames and get out of this craziness of scalping the market :) )

Buy the cross of lower band and see the upper cross back to the mean could be something there.
 

Attachments

  • jswQkxf.png
    jswQkxf.png
    184.9 KB · Views: 141
@netarchitech Thanks for the kind words. Yes I did see your links in the other post and then worked on this indicator. I did not want to use two studies to find high and low areas and for me having to do the reverse is not intuitive. hahaha easily confused. I need to look at your new links as doing the indicator was easy, knowing how to trade with it needs clarification.

No I had not seen BenTen post of it. Will take a look.
 
Thanks for the kind words.

You are certainly welcome :)

...doing the indicator was easy, knowing how to trade with it needs clarification.

I hear that...Plenty of times I cranked out something that looked so promising, only to find myself on the wrong side of the trade because I didn't spend the requisite time to clarify, as you say...That's one of the reasons why I moved to higher timeframes...I found myself with more time to desk-check, backtest and work the Risk/Money Management numbers. With that said, I now have to find the patience to give higher timeframe opportunities room to breathe...Alas, there's always something to deal with...

Good Luck and Good Trading :)
 
Due to the love of arrows and candle coloring I threw together some arrows for the study. Up arrows at low and down arrows at high according to the Chris Moody filter criteria as shown in the video from the other Vix Fix post. http://vimeopro.com/user32804960/tradingview-indicators/video/115973132

I am sure you will need to play with the settings of the period and look backs to have the study and arrows match you time frame of trading. The arrows are not tested in live trading so if you try it report back any success or failure please. That will help everyone. Add this code to the above study code for the arrows;

Code:
# Set up arrows

input ltLB = 40;
input mtLB = 14;
input str = 3;

def upRange_Aggr = close > close[1] and close > open[1];
def filtered_Aggr = (inv_WVF <= LowerBand );

def alert4 = upRange_Aggr and close > close[str] and (close < close[ltLB] or close < close[mtLB]) and filtered_Aggr ;

plot  up = if upRange_Aggr and close > close[str] and(close < close[ltLB] or close < close[mtLB]) and filtered_Aggr then alert4 else double.NaN ;

up.SetDefaultColor(Color.UPTICK);
up.SetPaintingStrategy(PaintingStrategy.ARROW_UP);

def downRange_Aggr = close < close[1] and close < open[1];
def filtereddwn_Aggr = (inv_WVF >= upperBand );

def alertdw = downRange_Aggr and close < close[str] and (close > close[ltLB] or close > close[mtLB]) and filtereddwn_Aggr ;

plot  down = if downRange_Aggr and close < close[str] and(close > close[ltLB] or close > close[mtLB]) and filtereddwn_Aggr then alertdw else double.NaN ;

down.SetDefaultColor(Color.DownTICK);
down.SetPaintingStrategy(PaintingStrategy.ARROW_DOWN);
 
Last edited:
Thank you. The arrows are almost impossible to see as they are at the top of the lower box. Anyway to make it visible? Especially the down arrows.
 
Just looked through my files, Mobius had posted a Vix Fix some time ago. Load this against the /ES on a daily aggregation.
It sure looks interesting. Please enjoy this

Code:
# Williams Vix Fix
# Mobius
# Addition of mean for easier reading.
# V01.2016

declare lower;

input n = 22;
plot WVF = (Highest (Close, n) - Low) / (Highest(Close, n)) * 100;
WVF.SetDefaultColor(Color.Cyan);

plot mean = inertiaAll(WVF);
mean.SetDefaultColor(Color.Gray);

addCloud(mean, WVF, color.green, color.red);

# End Code Williams Vix Fix
 
@horserider In your first screengrab at the top, the price seems to be painted according to your inverted VixFix (the lower study). Would you please post the code that does the price painting? Thank you.
 
I realize this thread has not been responded to in over a year, however I second what @Katsu said...is there a way to put a middle band in the existing cloud? I'm not a coder, however I did go through the script and try to figure it out but I'm not able to figure it out
 
@horserider Can you please add a midband on the bolinger?
I realize this thread has not been responded to in over a year, however I second what @Katsu said...is there a way to put a middle band in the existing cloud? I'm not a coder, however I did go through the script and try to figure it out but I'm not able to figure it out
change this statement:
def MidLine = Average(data = inv_WVF, period);
to:
plot MidLine = Average(data = inv_WVF, period);
 

Join useThinkScript to post your question to a community of 21,000+ developers and traders.

Thread starter Similar threads Forum Replies Date
D Combo Williams Vix Fix Indicator for ThinkorSwim Indicators 5
BenTen Williams’ VIX Fix Indicator for ThinkorSwim Indicators 117

Similar threads

Not the exact question you're looking for?

Start a new thread and receive assistance from our community.

87k+ Posts
426 Online
Create Post

Similar threads

Similar threads

The Market Trading Game Changer

Join 2,500+ subscribers inside the useThinkScript VIP Membership Club
  • Exclusive indicators
  • Proven strategies & setups
  • Private Discord community
  • ‘Buy The Dip’ signal alerts
  • Exclusive members-only content
  • Add-ons and resources
  • 1 full year of unlimited support

Frequently Asked Questions

What is useThinkScript?

useThinkScript is the #1 community of stock market investors using indicators and other tools to power their trading strategies. Traders of all skill levels use our forums to learn about scripting and indicators, help each other, and discover new ways to gain an edge in the markets.

How do I get started?

We get it. Our forum can be intimidating, if not overwhelming. With thousands of topics, tens of thousands of posts, our community has created an incredibly deep knowledge base for stock traders. No one can ever exhaust every resource provided on our site.

If you are new, or just looking for guidance, here are some helpful links to get you started.

What are the benefits of VIP Membership?
VIP members get exclusive access to these proven and tested premium indicators: Buy the Dip, Advanced Market Moves 2.0, Take Profit, and Volatility Trading Range. In addition, VIP members get access to over 50 VIP-only custom indicators, add-ons, and strategies, private VIP-only forums, private Discord channel to discuss trades and strategies in real-time, customer support, trade alerts, and much more. Learn all about VIP membership here.
How can I access the premium indicators?
To access the premium indicators, which are plug and play ready, sign up for VIP membership here.
Back
Top