Hi, I'm new here.
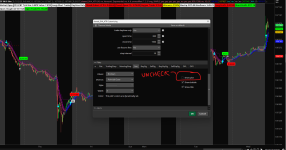
I really wanted to try out a Smoothed Heiken-Ashi study for TOS, since it is not available in the default program I looked for a script online, which brought me here. I edited the study from page 1.
I don't do much scripting but I thought others might find it useful.

I really wanted to try out a Smoothed Heiken-Ashi study for TOS, since it is not available in the default program I looked for a script online, which brought me here. I edited the study from page 1.
I don't do much scripting but I thought others might find it useful.
Code:
# Heikin Ashi Smoothed
# HoboTheClown / blt
# 9.15.2016

# HoboTheClown: I recently found a code for smoothed heiken ashi bars,
# however for some reason all the bars are displayed as one color (going up or down).
#
# blt: Modified the code and replaced the addchart code at the bottom,
# you should now see proper coloring. This is how that was coded to plot
# as an overlay to the chart candlesticks. That is two sets of candles,
# with different coloring for each. If you have the heikin ashi candle
# coloring code on your chart, then they will likely appear the same color.

#Update that "fixes" the green candles.
#JTP
#02/7/2021

input period = 20;
input hideCandles = Yes; #Now functional - JTP
input candleSmoothing = {default Valcu, Vervoort};

DefineGlobalColor("RisingMA", color.green);
DefineGlobalColor("FallingMA", color.red);

input movingAverageType = {Simple, default Exponential, Weighted, Hull, Variable, TEMA};

def openMA;
def closeMA;
def highMA;
def lowMA;

switch (movingAverageType) {
case Simple:
    openMA = compoundValue(1, Average(open, period), open);
    closeMA = compoundValue(1, Average(close, period), close);
    highMA = compoundValue(1, Average(high, period), high);
    lowMA = compoundValue(1, Average(low, period), low);
case Exponential:
    openMA = compoundValue(1, ExpAverage(open, period), open);
    closeMA = compoundValue(1, ExpAverage(close, period), close);
    highMA = compoundValue(1, ExpAverage(high, period), high);
    lowMA = compoundValue(1, ExpAverage(low, period), low);
case Weighted:
    openMA = compoundValue(1, WMA(open, period), open);
    closeMA = compoundValue(1, WMA(close, period), close);
    highMA = compoundValue(1, WMA(high, period), high);
    lowMA = compoundValue(1, WMA(low, period), low);
Case Hull:
    openMA = compoundValue(1, HullMovingAvg(open, period), open);
    closeMA = compoundValue(1, HullMovingAvg(close, period), close);
    highMA = compoundValue(1, HullMovingAvg(high, period), high);
    lowMA = compoundValue(1, HullMovingAvg(low, period), low);
case variable:
    openMA = compoundValue(1, VariableMA(open, period), open);
    closeMA = compoundValue(1, VariableMA(close, period), close);
    highMA = compoundValue(1, VariableMA(high, period), high);
    lowMA = compoundValue(1, VariableMA(low, period), low);
case TEMA:
    openMA = compoundValue(1, TEMA(open, period), open);
    closeMA = compoundValue(1, TEMA(close, period), close);
    highMA = compoundValue(1, TEMA(high, period), high);
    lowMA = compoundValue(1, TEMA(low, period), low);
}

hidePricePlot(hideCandles);

def haOpen;
def haClose;

switch(candleSmoothing) {
case Valcu:
    haOpen = CompoundValue(1, ( (haOpen[1] + (openMA[1] + highMA[1] + lowMA[1] + closeMA[1]) /4.0)/2.0), open);
    haClose = ((OpenMA + HighMA + LowMA + CloseMA)/4.0) ;

case Vervoort:
    haOpen = CompoundValue(1, ( (haOpen[1] + (openMA[1] + highMA[1] + lowMA[1] + closeMA[1]) /4.0)/2.0), open);
    haClose = ((((OpenMA + HighMA + LowMA + CloseMA)/4.0) + haOpen + Max(HighMA, haOpen) + Min(LowMA, haOpen))/4.0);
}

plot o = haOpen + 0;
o.hide();

### Wicks and Shadows

def haLow = min(lowMA, haOpen);
def haHigh = max(highMA,haOpen);

### NO LONGER SUPPORTED BY TOS
###
### AddChart(high = haHigh, low = haLow, open = o, close = haclose, type = ChartType.CANDLE, growColor = GlobalColor("RisingMA"), fallColor = GlobalColor("FallingMA"), neutralColor = color.gray);

#Red Candlesticks -----------------------------------------------------------------|

input charttype = ChartType.CANDLE;
def haOpen_fall = if haOpen>haClose
              then haOpen
              else double.nan;
def haHigh_fall   = if haOpen>=haClose
              then haHigh
              else double.nan;
def haLow_fall    = if haOpen>=haClose
              then haLow
              else double.nan;
def haClose_fall    = if haOpen>=haClose
              then haClose
              else double.nan;

AddChart(growColor = Color.red, fallColor = Color.green, neutralColor = Color.current, high = haHigh_fall, low = haLow_fall, open = haOpen_fall, close = haClose_fall , type = ChartType.CANDLE);

#Green Candlesticks -----------------------------------------------------------------|

#Removed and/or replaced - JTP
#def HAclose1 = if haOpen<=haClose
               # then hahigh
               # else double.nan;
#def HAclose1 = ohlc4 -1;
#def HAopen1  = if haopen<=haclose
              #  then haclose
              # then CompoundValue(1, (HAopen[1] + HAclose[1]) /2, (open[1] + close[1]) / 2)
              # else double.nan;

def haOpen_rise = if haOpen<haClose
                then haClose
                else double.nan;
def haHigh_rise  = if haOpen<=haClose
              then haHigh
              else double.nan;
def haLow_rise   = if haOpen<=haClose
              then haLow
              else double.nan;
def haClose_rise   = if haOpen<=haClose
              then haOpen
              else double.nan;

AddChart(growColor = Color.green, fallColor = Color.red, neutralColor = Color.current, high = haHigh_rise, low = haLow_rise, open = haOpen_rise, close = HAclose_rise, type = ChartType.CANDLE);

# End Study
##############################################################################
Last edited by a moderator: