MACD with Bollinger Bands Indicator for ThinkorSwim

BenTen

Administrative
Staff member
Staff
VIP
Lifetime
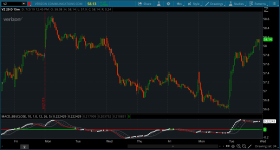
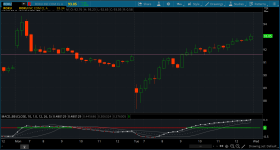
This indicator (most people called it MACD BB) plots MACD along with the Bollinger Bands as a lower study on your ThinkorSwim chart. The usage is fairly simple and up for interpretation. You can use it to identify short term trends or search for squeeze.

Y5YNfKx.png

VuKsabx.png


thinkScript Code

Code:
# TS_MACD_BB
# By Eric Purdy, ThinkScripter LLC
# http://www.thinkscripter.com
# [email protected]
# Last Update 07 Feb 2011

declare lower;

input price = close;
input BBlength = 10;
input BBNum_Dev = 1.0;
input MACDfastLength = 12;
input MACDslowLength = 26;
input MACDLength = 5;

def MACD_Data = MACD(fastLength = MACDfastLength, slowLength = MACDslowLength, MACDLength = MACDLength);

plot MACD_Dots = MACD_Data;
plot MACD_Line = MACD_Data;

plot BB_Upper = reference BollingerBands(price = MACD_Line, length = BBlength, Num_Dev_Dn = -BBNum_Dev, Num_Dev_Up = BBNum_Dev).UpperBand;
plot BB_Lower = reference BollingerBands(price = MACD_Line, length = BBlength, Num_Dev_Dn = -BBNum_Dev, Num_Dev_Up = BBNum_Dev).Lowerband;
plot BB_Midline = reference BollingerBands(price = MACD_Line, length = BBlength, Num_Dev_Dn = -BBNum_Dev, Num_Dev_Up = BBNum_Dev).MidLine;

BB_Upper.SetDefaultColor(Color.GRAY);
BB_Lower.SetDefaultColor(Color.GRAY);
BB_Midline.SetDefaultColor(Color.GRAY);
BB_Midline.SetStyle(Curve.SHORT_DASH);

MACD_Line.SetDefaultColor(Color.WHITE);

MACD_Dots.SetStyle(Curve.POINTS);
MACD_Dots.SetLineWeight(2);
MACD_Dots.AssignValueColor(if MACD_Line > MACD_Line[1] then Color.White

else Color.DARK_RED);

plot zero = 0;
zero.AssignValueColor(if MACD_Line < 0 then Color.RED else Color.GREEN);
zero.SetLineWeight(2);

Shareable Link

https://tos.mx/fK5Zaj

Note: The default Bollinger Bands indicator in ThinkorSwim uses the 20 Simple Moving Average with 2.0 Standard Deviation. If you want to keep it that way make sure you adjust the settings for this indicator.
 

Attachments

  • Y5YNfKx.png
    Y5YNfKx.png
    120.6 KB · Views: 398
  • VuKsabx.png
    VuKsabx.png
    107.7 KB · Views: 456
Hi @BenTen thanks for sharing this indicator.. is there any way for you to write the code to add green or red arrow on the main chart to indicate bullish and bearish
 
@BenTen bullish alert on the main chart when the dots on MACD signal line turns is white and the signal line is move upper band of BB, bearish alert on the main chart when the dots on MACD signal line turns iso red and MACD signal line is below the lower band of BB
 
@vijayonline Here you go:

Code:
# TS_MACD_BB
# By Eric Purdy, ThinkScripter LLC
# http://www.thinkscripter.com
# [email protected]
# Last Update 07 Feb 2011

input price = close;
input BBlength = 10;
input BBNum_Dev = 1.0;
input MACDfastLength = 12;
input MACDslowLength = 26;
input MACDLength = 5;

def MACD_Data = MACD(fastLength = MACDfastLength, slowLength = MACDslowLength, MACDLength = MACDLength);

def MACD_Dots = MACD_Data;
def MACD_Line = MACD_Data;

def BB_Upper = reference BollingerBands(price = MACD_Line, length = BBlength, Num_Dev_Dn = -BBNum_Dev, Num_Dev_Up = BBNum_Dev).UpperBand;
def BB_Lower = reference BollingerBands(price = MACD_Line, length = BBlength, Num_Dev_Dn = -BBNum_Dev, Num_Dev_Up = BBNum_Dev).Lowerband;
def BB_Midline = reference BollingerBands(price = MACD_Line, length = BBlength, Num_Dev_Dn = -BBNum_Dev, Num_Dev_Up = BBNum_Dev).MidLine;

def red_cond = !MACD_Line > MACD_Line[1];
def cond1 = MACD_Line > MACD_Line[1] and MACD_Line > BB_Upper;
def cond2 = red_cond and MACD_Line < BB_Lower;

# Plot Signals
plot bullish = cond1;
bullish.SetPaintingStrategy(PaintingStrategy.BOOLEAN_ARROW_UP);
bullish.SetDefaultColor(Color.GREEN);
bullish.SetLineWeight(1);
plot bearish = cond2;
bearish.SetPaintingStrategy(PaintingStrategy.BOOLEAN_ARROW_DOWN);
bearish.SetDefaultColor(Color.RED);
bearish.SetLineWeight(1);
 
Thanks @BenTen for the quick response however there seem to be some problem its plotting green arrows continuously when the macD signal line stays above the upper BB also I see the bearish signal might need some work
 
@vijayonline I'm just following the conditions above. Feel free to point out what needs to change. If you can, please post some screenshots of your idea as well.
 
@BenTen Hello, you said that it is up for interpretation but I am curious how do the bollinger bands and the MACD line relate to each other? Thank you.
 
@s1111 added red bands to keep yo out of the bollinger if you like.

Code:
# TS_MACD_BB
# By Eric Purdy, ThinkScripter LLC
# [URL]http://www.thinkscripter.com[/URL]
# [EMAIL][email protected][/EMAIL]
# Last Update 07 Feb 2011

declare lower;

input price = close;
input BBlength = 10;
input BBNum_Dev = 1.0;
input MACDfastLength = 12;
input MACDslowLength = 26;
input MACDLength = 5;

def MACD_Data = MACD(fastLength = MACDfastLength, slowLength = MACDslowLength, MACDLength = MACDLength);

plot MACD_Dots = MACD_Data;
plot MACD_Line = MACD_Data;

plot BB_Upper = reference BollingerBands(price = MACD_Line, length = BBlength, Num_Dev_Dn = -BBNum_Dev, Num_Dev_Up = BBNum_Dev).UpperBand;
plot BB_Lower = reference BollingerBands(price = MACD_Line, length = BBlength, Num_Dev_Dn = -BBNum_Dev, Num_Dev_Up = BBNum_Dev).Lowerband;
plot BB_Midline = reference BollingerBands(price = MACD_Line, length = BBlength, Num_Dev_Dn = -BBNum_Dev, Num_Dev_Up = BBNum_Dev).MidLine;

BB_Upper.SetDefaultColor(Color.GRAY);
BB_Lower.SetDefaultColor(Color.GRAY);
BB_Midline.SetDefaultColor(Color.GRAY);
BB_Midline.SetStyle(Curve.SHORT_DASH);

MACD_Line.SetDefaultColor(Color.WHITE);

MACD_Dots.SetStyle(Curve.POINTS);
MACD_Dots.SetLineWeight(2);
MACD_Dots.AssignValueColor(if MACD_Line > MACD_Line[1] then Color.White

else Color.DARK_RED);

plot zero = 0;
zero.AssignValueColor(if MACD_Line < 0 then Color.RED else Color.GREEN);
zero.SetLineWeight(2);


AddCloud( bb_Upper, bb_Lower, Color.light_RED );
 
Do the tickers in the watchlist change based on scan results or are they always the same tickers? Thanks, everyone for putting this together
 
Do the tickers in the watchlist change based on scan results or are they always the same tickers? Thanks, everyone for putting this together
You can change them to whichever has the highest number to stay on top of the watchlist. I have my watchlist to show the highest amount change .
 
Last edited:
You can change them to which every has the highest number to stay on top of the watchlist. I have my watchlist to show the highest amount change .
I mean do the stocks change. Like is this a scan based watchlist or just names you like? Do you trade this intraday what is the exit?
 
Last edited:
I mean do the stocks change. Like is this a scan based watchlist or just names you like? Do you trade this intraday what is the exit?
Stock changes from first to whatever many I have on my watchlist depending on the bb number. I have it set to 10 min time frame. I'm new to trading , I'm learning to scalp options.

I'm following his technic, works great. I just need to learn to wait for the right setup and not rush lol.
https://usethinkscript.com/threads/...s-bb-indicator-for-thinkorswim.287/post-43308
 
@BenTen Hi, would it be possible to shed some light on how this indicator (MACD & BB) could be used the best way? your thoughts/inputs on where to enter/exit will be much appreciate it.
 
Thank you very much @BenTen for posting this and @Hypoluxa for sharing your strategy. It looks pretty solid.

I've been monkeying around with it today and became inspired. I'm generally a scalper, so I modified the color settings in the script a bit to guide me. Possibly it could help you or someone else here. It has a bit of a "don't diddle in the middle" vibe.

Edit: Since I posted this, I've made another addition. It is a cloud that displays when there is a standard bollinger/kelter squeeze (aka ttm_squeeze) going on. Just another confirm/deny layer. The new code is now displayed below but it is not displayed in the image shown.

ODubnuW.png


Code:
# TS_MACD_BB

# By Eric Purdy, ThinkScripter LLC

# http://www.thinkscripter.com

# [email protected]

# Last Update 07 Feb 2011

# modification to color scheme by Rick_K 12/26/20.


declare lower;


input price = close;

input BBlength = 10;

input BBNum_Dev = 1.0;

input MACDfastLength = 12;

input MACDslowLength = 26;

input MACDLength = 5;


def MACD_Data = MACD(fastLength = MACDfastLength, slowLength = MACDslowLength, MACDLength = MACDLength);


plot MACD_Dots = MACD_Data;

plot MACD_Line = MACD_Data;


plot BB_Upper = reference BollingerBands(price = MACD_Line, length = BBlength, Num_Dev_Dn = -BBNum_Dev, Num_Dev_Up = BBNum_Dev).UpperBand;

plot BB_Lower = reference BollingerBands(price = MACD_Line, length = BBlength, Num_Dev_Dn = -BBNum_Dev, Num_Dev_Up = BBNum_Dev).Lowerband;

plot BB_Midline = reference BollingerBands(price = MACD_Line, length = BBlength, Num_Dev_Dn = -BBNum_Dev, Num_Dev_Up = BBNum_Dev).MidLine;


BB_Upper.SetDefaultColor(Color.CYAN);

BB_Lower.SetDefaultColor(Color.CYAN);

#BB_Midline.SetDefaultColor(Color.GRAY);

#BB_Midline.SetStyle(Curve.SHORT_DASH);


#MACD_Line.AssignValueColor(if MACD_Line > MACD_Line[1] then color.green else color.red);

MACD_Line.AssignValueColor(if MACD_Line > MACD_Line[1] and MACD_Line >= BB_Upper then Color.GREEN else if MACD_Line < MACD_Line[1] and MACD_Line >= BB_Upper then Color.DARK_GREEN else if MACD_Line < MACD_Line[1] and MACD_Line <= BB_Lower then Color.RED else if MACD_Line > MACD_Line[1] and MACD_Line <= BB_Lower then Color.DARK_RED else Color.GRAY);

MACD_Line.SetLineWeight(1);


#MACD_Dots.AssignValueColor(if MACD_Line > MACD_Line[1] then Color.green else Color.RED);

MACD_Dots.AssignValueColor(if MACD_Line > MACD_Line[1] and MACD_Line > BB_Upper then Color.GREEN else if MACD_Line < MACD_Line[1] and MACD_Line > BB_Upper then Color.DARK_GREEN else if MACD_Line < MACD_Line[1] and MACD_Line < BB_Lower then Color.RED else if MACD_Line > MACD_Line[1] and MACD_Line < BB_Lower then Color.DARK_RED else Color.GRAY);

MACD_Dots.SetPaintingStrategy(PaintingStrategy.LINE_VS_POINTS);

MACD_Dots.SetLineWeight(2);


plot zero = 0;

zero.SetDefaultColor(Color.WHITE);

zero.SetStyle(Curve.SHORT_DASH);

zero.SetLineWeight(1);


## end original (modified) code


######Add Squeeze Cloud##########


###### Keltner Channels


input displace = 0;

input factor = 1.5;

input length = 20;

input averageType = AverageType.EXPONENTIAL;

input trueRangeAverageType = AverageType.EXPONENTIAL;


def shift = factor * MovingAverage(trueRangeAverageType, TrueRange(high, close, low), length);

def average = MovingAverage(averageType, price, length);

def Avg = average[-displace];

def Upper_Band = average[-displace] + shift[-displace];

def Lower_Band = average[-displace] - shift[-displace];


######## Bollinger Bands

input BBLength2 = 20;

input Num_Dev_Dn = -2.0;

input Num_Dev_up = 2.0;

input bb_averageType = AverageType.SIMPLE;


def sDev = StDev(data = price[-displace], length = BBLength2);


def MidLine = MovingAverage(bb_averageType, data = price[-displace], length = BBLength2);

def LowerBand = MidLine + Num_Dev_Dn * sDev;

def UpperBand = MidLine + Num_Dev_up * sDev;


### end of script

AddCloud(if UpperBand <= Upper_Band and LowerBand >= Lower_Band then BB_Upper else BB_Lower,  BB_Lower,  Color.yellow);


### END
 
Last edited:
I like the way your BB line looks with green gray and red . I have been using @germanburrito script. https://usethinkscript.com/threads/...s-bb-indicator-for-thinkorswim.287/post-43812
I like the way it looks , my kids says its a road lol. Is there something you can code where everything same with @germanburrito script but add your bb sytle? Thanks in advcance @RickK


Sure @s1111. I like that. Just find the section in the @germanburrito script that looks
like this:
Code:
MACD_Line.SetDefaultColor(Color.WHITE);

MACD_Dots.SetStyle(Curve.POINTS);
MACD_Dots.SetLineWeight(2);
MACD_Dots.AssignValueColor(if MACD_Line > MACD_Line[1] then Color.White else Color.DARK_RED);

..... and replace all that with the following code:


Code:
MACD_Line.AssignValueColor(if MACD_Line > MACD_Line[1] and MACD_Line >= BB_Upper then Color.GREEN else if MACD_Line < MACD_Line[1] and MACD_Line >= BB_Upper then Color.DARK_GREEN else if MACD_Line < MACD_Line[1] and MACD_Line <= BB_Lower then Color.RED else if MACD_Line > MACD_Line[1] and MACD_Line <= BB_Lower then Color.DARK_RED else Color.GRAY);
MACD_Line.SetLineWeight(1);

MACD_Dots.AssignValueColor(if MACD_Line > MACD_Line[1] and MACD_Line > BB_Upper then Color.GREEN else if MACD_Line < MACD_Line[1] and MACD_Line > BB_Upper then Color.DARK_GREEN else if MACD_Line < MACD_Line[1] and MACD_Line < BB_Lower then Color.RED else if MACD_Line > MACD_Line[1] and MACD_Line < BB_Lower then Color.DARK_RED else Color.GRAY);
MACD_Dots.SetPaintingStrategy(PaintingStrategy.LINE_VS_POINTS);
MACD_Dots.SetLineWeight(2);

.
Notice in the new code that the MACD_Line has to be greater "or equal" (or less than "or equal") whereas the dots must be completely greater (or less than). If zoomed in enough, a green line preceding a green dot could give you a heads up that a good signal is coming.
 
I like the way your BB line looks with green gray and red . I have been using @germanburrito script. https://usethinkscript.com/threads/...s-bb-indicator-for-thinkorswim.287/post-43812

I like the way it looks , my kids says its a road lol. Is there something you can code where everything same with @germanburrito script but add your bb style? Thanks in advance @RickK
Code:
# TS_MACD_BB

# By Eric Purdy, ThinkScripter LLC

# http://www.thinkscripter.com

# [email protected]

# Last Update 07 Feb 2011

# modification to color scheme by Rick_K 12/26/20.


declare lower;


input price = close;

input BBlength = 10;

input BBNum_Dev = 1.0;

input MACDfastLength = 12;

input MACDslowLength = 26;

input MACDLength = 5;


def MACD_Data = MACD(fastLength = MACDfastLength, slowLength = MACDslowLength, MACDLength = MACDLength);


plot MACD_Dots = MACD_Data;

plot MACD_Line = MACD_Data;


plot BB_Upper = reference BollingerBands(price = MACD_Line, length = BBlength, Num_Dev_Dn = -BBNum_Dev, Num_Dev_Up = BBNum_Dev).UpperBand;

plot BB_Lower = reference BollingerBands(price = MACD_Line, length = BBlength, Num_Dev_Dn = -BBNum_Dev, Num_Dev_Up = BBNum_Dev).Lowerband;

plot BB_Midline = reference BollingerBands(price = MACD_Line, length = BBlength, Num_Dev_Dn = -BBNum_Dev, Num_Dev_Up = BBNum_Dev).MidLine;


BB_Upper.SetDefaultColor(Color.CYAN);

BB_Lower.SetDefaultColor(Color.CYAN);

#BB_Midline.SetDefaultColor(Color.GRAY);

#BB_Midline.SetStyle(Curve.SHORT_DASH);


#MACD_Line.AssignValueColor(if MACD_Line > MACD_Line[1] then color.green else color.red);

MACD_Line.AssignValueColor(if MACD_Line > MACD_Line[1] and MACD_Line >= BB_Upper then Color.GREEN else if MACD_Line < MACD_Line[1] and MACD_Line >= BB_Upper then Color.DARK_GREEN else if MACD_Line < MACD_Line[1] and MACD_Line <= BB_Lower then Color.RED else if MACD_Line > MACD_Line[1] and MACD_Line <= BB_Lower then Color.DARK_RED else Color.GRAY);

MACD_Line.SetLineWeight(1);


#MACD_Dots.AssignValueColor(if MACD_Line > MACD_Line[1] then Color.green else Color.RED);

MACD_Dots.AssignValueColor(if MACD_Line > MACD_Line[1] and MACD_Line > BB_Upper then Color.GREEN else if MACD_Line < MACD_Line[1] and MACD_Line > BB_Upper then Color.DARK_GREEN else if MACD_Line < MACD_Line[1] and MACD_Line < BB_Lower then Color.RED else if MACD_Line > MACD_Line[1] and MACD_Line < BB_Lower then Color.DARK_RED else Color.GRAY);

MACD_Dots.SetPaintingStrategy(PaintingStrategy.LINE_VS_POINTS);

MACD_Dots.SetLineWeight(1);


plot zero = 0;

zero.SetDefaultColor(Color.WHITE);

zero.SetStyle(Curve.SHORT_DASH);

zero.SetLineWeight(1);


## end original (modified) code


######Add Squeeze Cloud##########


###### Keltner Channels


input displace = 0;

input factor = 1.5;

input length = 20;

input averageType = AverageType.EXPONENTIAL;

input trueRangeAverageType = AverageType.EXPONENTIAL;


def shift = factor * MovingAverage(trueRangeAverageType, TrueRange(high, close, low), length);

def average = MovingAverage(averageType, price, length);

def Avg = average[-displace];

def Upper_Band = average[-displace] + shift[-displace];

def Lower_Band = average[-displace] - shift[-displace];


######## Bollinger Bands

input BBLength2 = 20;

input Num_Dev_Dn = -2.0;

input Num_Dev_up = 2.0;

input bb_averageType = AverageType.SIMPLE;


def sDev = StDev(data = price[-displace], length = BBLength2);


def MidLine = MovingAverage(bb_averageType, data = price[-displace], length = BBLength2);

def LowerBand = MidLine + Num_Dev_Dn * sDev;

def UpperBand = MidLine + Num_Dev_up * sDev;


### end of script

AddCloud(if UpperBand <= Upper_Band and LowerBand >= Lower_Band then BB_Upper else BB_Lower,  BB_Lower,  Color.yellow);

AddCloud( bb_Upper, bb_Lower, Color.light_RED );
### END
 
Last edited:

Join useThinkScript to post your question to a community of 21,000+ developers and traders.

Similar threads

Not the exact question you're looking for?

Start a new thread and receive assistance from our community.

87k+ Posts
309 Online
Create Post

Similar threads

Similar threads

The Market Trading Game Changer

Join 2,500+ subscribers inside the useThinkScript VIP Membership Club
  • Exclusive indicators
  • Proven strategies & setups
  • Private Discord community
  • ‘Buy The Dip’ signal alerts
  • Exclusive members-only content
  • Add-ons and resources
  • 1 full year of unlimited support

Frequently Asked Questions

What is useThinkScript?

useThinkScript is the #1 community of stock market investors using indicators and other tools to power their trading strategies. Traders of all skill levels use our forums to learn about scripting and indicators, help each other, and discover new ways to gain an edge in the markets.

How do I get started?

We get it. Our forum can be intimidating, if not overwhelming. With thousands of topics, tens of thousands of posts, our community has created an incredibly deep knowledge base for stock traders. No one can ever exhaust every resource provided on our site.

If you are new, or just looking for guidance, here are some helpful links to get you started.

What are the benefits of VIP Membership?
VIP members get exclusive access to these proven and tested premium indicators: Buy the Dip, Advanced Market Moves 2.0, Take Profit, and Volatility Trading Range. In addition, VIP members get access to over 50 VIP-only custom indicators, add-ons, and strategies, private VIP-only forums, private Discord channel to discuss trades and strategies in real-time, customer support, trade alerts, and much more. Learn all about VIP membership here.
How can I access the premium indicators?
To access the premium indicators, which are plug and play ready, sign up for VIP membership here.
Back
Top