
https://tos.mx/9TuHJlR

Please Read all of the Notes
Multicollinearity is a statistical term referring to the unknowing use of the same type of information more than once.
Here is how John Bollinger puts it: “A cardinal rule for the successful use of technical analysis requires avoiding multicollinearity amid indicators. Multicollinearity is simply the multiple counting of the same information. The use of four different indicators all derived from the same series of closing prices to confirm each other is a perfect example.”
The best way to quickly determine if an indicator is collinear with another one is to chart it. If they rise and fall in essentially the same areas, the odds are that they are collinear, and you should just use one of them.
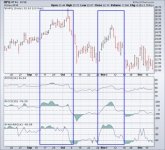
The first chart below shows some examples of indicators that are collinear. Notice that all the indicators are basically saying the same thing. Pick one of the indicators for your analysis and do not use the others.

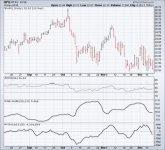
Next are some examples of indicators that are not collinear. These are not similar at all and, when interpreted correctly, each will give different information. It may be supportive, or it may not.

Bottom Line: If you are randomly selecting indicators to support your analysis, you will more than likely fall into the multicollinearity trap. They are not giving you any additional information. Though they can be appealing, they are ultimately misleading.
Please Read all of the Notes
Code:
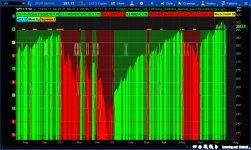
#Stoplight_Indicator_v2 by Lar aka zzz aka BLT
#Original concept by ChrisStoplight, By Chris Ball (xxx) on 1/31/09
#Added Choppiness and Squeeze Indicator by Mobius@Thinkscript Lounge
#Added FW_Mobo_Basic
#Modified to add/change indicators
#Revised by StanL 4/25/14 to (1) clarify labels; (2) add explanation of how MOBO works; (3) #Modified the MOBO labels;  No calculations were modified.
#1-10-19 Markos: Commented out AddCloud's for visibility
##It works, not broken, trying to learn##
##Questions by markos for all our learning and have double pound signs##
##Some AddClouds are listed once per study and others listed twice. Clues?##The AddClouds Input is Different than those below that are commented out##
##why are price coloring lines 233 & 236 listed twice##

declare lower; ## After loading,I drag it up##
input showlabels = yes;
input showclouds = yes;
input pricecolor = yes;
input rsilength  = 14;
def c = close;
def h = high;
def l = low;
def o = open;

#Polarized Fractal Efficiency
input lengthpfe = 8;
input smoothingLength = 3;
def diffpfe = c - c[lengthpfe - 1];
def val = 100 * Sqrt(Sqr(diffpfe) + Sqr(lengthpfe)) / Sum(Sqrt(1 + Sqr(c - c[1])), lengthpfe - 1);
def PFE = ExpAverage(if diffpfe > 0 then val else -val, smoothingLength);
plot pfepos = if PFE > 0 then 2 else 1;
pfepos.SetDefaultColor(Color.GREEN);
plot pfeneg = if PFE < 0 then 2 else 1;
pfeneg.SetDefaultColor(Color.RED);
#AddCloud(if showclouds then pfepos else Double.NaN, if showclouds then pfeneg else Double.NaN , Color.GREEN);

#MOMENTUM
input lengthmo = 5;
def Momentum = c - c[lengthmo];
plot mopos = if Momentum >= 0 then 3 else 2;
mopos.SetDefaultColor(Color.Light_GREEN);
plot moneg = if Momentum < 0 then 3 else 2;
moneg.SetDefaultColor(Color.RED);
#AddCloud(if showclouds then mopos else Double.NaN, if showclouds then moneg else Double.NaN, Color.GREEN);

#CCI
input lengthcci = 13;
def pricecci = c + l + h;
def linDev = LinDev(pricecci, lengthcci);
def CCI = if linDev == 0 then 0 else (pricecci - Average(pricecci, lengthcci)) / linDev / 0.015;
plot cci1 = if CCI >= 0 then 4 else 3;
cci1.SetDefaultColor(Color.GREEN);
plot cci2 = if CCI < 0 then 4 else 3;
cci2.SetDefaultColor(Color.RED);
#AddCloud(if showclouds then cci1 else Double.NaN, if showclouds then cci2 else Double.NaN, Color.GREEN);

#RSI
def rsi   = reference RSI(length = rsilength)."RSI";
plot rsi1 = if rsi >= 50 then 5 else 4;
plot rsi2 = if rsi < 50  then 5 else 4;

rsi1.SetDefaultColor(Color.GREEN);
rsi2.SetDefaultColor(Color.RED);

#AddCloud(if showclouds then rsi1 else Double.NaN, if showclouds then rsi2 else Double.NaN, color1 = Color.GREEN);

#Bollinger Bands MOBO
#Explanation of how this works.  +/- 0.8 std deviation Bollinger Bands are the criteria for bullish/bearish plots. When the close rises above the upper band the signal is bullish and stays bullish until the close moves below the lower band when the plot turns to bearish and remains bearish until the close rises above the upper band.

input lengthmobo = 10;
input Num_Dev_Dn = -0.8;
input Num_Dev_up =  0.8;

def sDev = StDev(data = c, length = lengthmobo);

def Midmobo = Average(c, length = lengthmobo);

def Lowermobo = Midmobo + Num_Dev_Dn * sDev;

def Uppermobo = Midmobo + Num_Dev_up * sDev;

def upmobo = if upmobo[1] == 0 and c >= Uppermobo then 1 else if upmobo[1] == 1 and c > Lowermobo then 1 else 0;

def upmo = if upmobo  and c > Uppermobo then 1 else 0;

def dnmo = if !upmobo and c > Lowermobo then 1 else 0;

plot mobo1 = if upmobo == 1 then 6 else 5;

mobo1.SetDefaultColor(Color.GREEN);

plot mobo2 = if upmobo == 0 then 6 else 5;

mobo2.SetDefaultColor(Color.RED);

#AddCloud(if showclouds then mobo1 else Double.NaN, if showclouds then mobo2 else Double.NaN, Color.GREEN);

#Trend
#Choppiness Indicator from Mobius @My Trade with color changes by Lar
#Set ADX & SMA to how you trade
#Indicates Trending or Chop along with current ADX level

def ADXLength     = 10; #TOS default 10

input AverageType = AverageType.HULL;

def AvgLength     = 13; #TOS default 8

def Lengthchop    = 13;

def Signal        = 8;

def Choppy        = 61.8;

def MidLine       = 50;

def Trending      = 38.2;

def ADX = Round(reference ADX(length = ADXLength), 0);

def AVG = MovingAverage(AverageType = AverageType, c, AvgLength);

def CIB = ((Log(Sum(TrueRange(h, c, l), Lengthchop) /

             (Highest(if h >= c[1] then h else

             c[1], Lengthchop) -

             Lowest( if l <= c[1] then l else c[1], Lengthchop)))

             / Log(10)) / (Log(Lengthchop) / Log(10))) * 100;

def CI  = CIB;

#Choppiness/Trend Indicator

plot chop = if CI > MidLine then 7 else 6;
chop.SetDefaultColor(Color.YELLOW);

plot trend1 = if CI < MidLine then 7 else 6;
trend1.SetDefaultColor(Color.GRAY);

#AddCloud(if showclouds then chop else Double.NaN, if showclouds then trend1 else Double.NaN, Color.YELLOW, Color.CYAN);
#AddCloud(if showclouds then chop else Double.NaN, if showclouds then trend1 else Double.NaN, Color.YELLOW, Color.CYAN);

#Overall - Covers over the individual indicator plots

def ppfe   = if pfepos == 2 then 1 else if pfeneg == 2 then -1 else 0;

def pmo    = if mopos == 3 then 1 else if moneg == 3 then -1 else 0;

def pcci   = if cci1 == 4 then 1 else if cci2 == 4 then -1 else 0;

def prsi   = if rsi1 == 5 then 1 else if rsi2 == 5 then -1 else 0;

def pmobo  = if mobo1 == 6 then 1 else if mobo2 == 6 then -1 else 0;

def sumall = Sum(ppfe + pmo + pcci + prsi + pmobo, 1);

plot uptrend = if sumall >= 1 then 8 else 0;
uptrend.SetDefaultColor(Color.GREEN);

plot dntrend = if sumall <= -1 then 8 else 0;
dntrend.SetDefaultColor(Color.RED);

AddCloud(if showclouds then uptrend else Double.NaN, if showclouds then dntrend else Double.NaN, Color.GREEN, Color.RED);

#Squeeze by Mobius @ My Trade with color mod by Lar
#Look at Cloud Color as a possible indication of direction once squeeze ends#

def nK            = 1.5;

def nBB           = 2.0;

def lengthsqueeze = 14;

def BBHalfWidth = StDev(c, lengthsqueeze);

def KCHalfWidth = nK * Average(TrueRange(h,  c,  l),  lengthsqueeze);

def isSqueezed  =  nBB * BBHalfWidth / KCHalfWidth < 1;

#Squeeze for Longer Term Trend Indicator

plot BBS_Ind = if isSqueezed then 8 else 8;

BBS_Ind.AssignValueColor(if isSqueezed then Color.DARK_ORANGE else Color.BLACK);

BBS_Ind.SetPaintingStrategy(PaintingStrategy.POINTS);

BBS_Ind.SetLineWeight(2);

BBS_Ind.HideBubble();

#Line Spacer
plot line9 = 9;

line9.SetDefaultColor(Color.DARK_GRAY);

#Labels

AddLabel(showlabels, "1:2 = Polarized Fractal(" + lengthpfe + ") = " + Round(PFE, 0), if pfepos == 2 then Color.GREEN else Color.RED);

AddLabel(showlabels, "2:3 = MOMENTUM( " + lengthmo + ") = " + Round(Momentum, 3), if Momentum >= 0 then Color.GREEN else Color.RED);

AddLabel(showlabels, "3:4 = CCI(" + lengthcci + ") = " + Round(CCI, 0), if CCI >= 0 then Color.GREEN else Color.RED);

AddLabel(showlabels, "4:5 RSI(" + rsilength + ") = " + Round(rsi, 0), if reference RSI(length = rsilength)."RSI" >= 50 then Color.GREEN else Color.RED);

AddLabel( upmobo and  c > Uppermobo, "5:6 MOBO Bullish close is above the upper BB", Color.GREEN);

AddLabel( upmobo == 0 and mobo2  == 6 and  c < Lowermobo, "5:6 MOBO Bearish close is below the lower BB", Color.RED);

AddLabel( upmobo and  c < Uppermobo, "5:6 MOBO Bullish close is between bands", Color.GREEN);

AddLabel( upmobo == 0 and mobo2  == 6  and  c > Lowermobo, "5:6 MOBO Bearish close is between bands", Color.RED);

AddLabel(showlabels, if CI > MidLine and CI < 62  then "MILD CHOP " + Round(CI, 0) else if CI >= 61.8 then "STRONG CHOP " + Round(CI, 0) else if CI <= MidLine and CI > 31.8 then " MILD TRENDING " + Round(CI, 0) else "STRONG TRENDING " + Round(CI, 0), if CI > MidLine then Color.YELLOW else Color.CYAN);

#ADX
AddLabel(showlabels, "ADX " + ADX, Color.CYAN);

AddLabel(showlabels, if uptrend == 8 and sumall == 5 then "All Up" else if uptrend == 8 and sumall >= 1 then "Most Up" else if dntrend == 8 and sumall == -5 then "All Down" else if dntrend == 8 and sumall <= -1 then "Most Down" else "No Trend ", if uptrend == 8 and sumall == 5 then Color.GREEN else if uptrend == 8 and sumall >= 1 then Color.LIGHT_GREEN else if dntrend == 8 and sumall == -5 then Color.RED else if dntrend == 8 and sumall <= -1 then Color.LIGHT_RED else Color.GRAY);

#Count of Periods in consecutive squeeze
rec count = if isSqueezed then count[1] + 1 else 0;
AddLabel(yes, if isSqueezed then Concat("Squeeze ", count) else "No Squeeze", Color.LIGHT_ORANGE);

#Price Coloring
AssignPriceColor(if pricecolor then if sumall >= 1 and close >= open then Color.GREEN else if sumall >= 1 and close < open then Color.DARK_GREEN else if sumall <= -1 and close <= open then Color.RED else if sumall <= -1 and close > open then Color.DARK_RED else Color.YELLOW else Color.CURRENT);

AssignPriceColor(if pricecolor then if sumall >= 1 and close >= open then Color.GREEN else if sumall >= 1 and close < open then Color.DARK_GREEN else if sumall <= -1 and close <= open then Color.RED else if sumall <= -1 and close > open then Color.DARK_RED else Color.YELLOW else Color.CURRENT);
#END#
Multicollinearity is a statistical term referring to the unknowing use of the same type of information more than once.
Here is how John Bollinger puts it: “A cardinal rule for the successful use of technical analysis requires avoiding multicollinearity amid indicators. Multicollinearity is simply the multiple counting of the same information. The use of four different indicators all derived from the same series of closing prices to confirm each other is a perfect example.”
The best way to quickly determine if an indicator is collinear with another one is to chart it. If they rise and fall in essentially the same areas, the odds are that they are collinear, and you should just use one of them.
The first chart below shows some examples of indicators that are collinear. Notice that all the indicators are basically saying the same thing. Pick one of the indicators for your analysis and do not use the others.
Next are some examples of indicators that are not collinear. These are not similar at all and, when interpreted correctly, each will give different information. It may be supportive, or it may not.
Bottom Line: If you are randomly selecting indicators to support your analysis, you will more than likely fall into the multicollinearity trap. They are not giving you any additional information. Though they can be appealing, they are ultimately misleading.
Attachments
Last edited: