Premarket After-market For ThinkOrSwim

BenTen

Administrative
Staff member
Staff
VIP
Lifetime
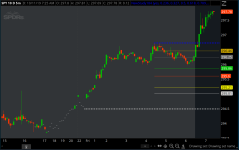
This indicator for ThinkorSwim will automatically plot overnight High and Low on your chart. In addition, the indicator will also include Fibonacci retracement based on the highest and lowest values from pre-market.

This can be useful for anyone who often plays pre-market breakout or breakdown. You may want to check out this strategy as well.

uUiRGl0.png


thinkScript Code

Rich (BB code):
# GlobeX or Overnight High / Low with Fibonacci Values 

# Mobius 

# V01.2012 

input PlotOverNightExtremes = yes;

input coeff_1 = .236;

input coeff_2 = .327;

# gmh: added the rest of the Fibs 

input coeff_3 = .500;

input coeff_4 = .618;

input coeff_5 = .789;

input coeff_6 = .882;


def o = open;

def h = high;

def l = low;

def c = close;

def v = volume;

def bar = BarNumber();

def GlobeX = GetTime() < RegularTradingStart(GetYYYYMMDD());

def vol = if GlobeX and !Globex[1]

          then v

          else if GlobeX

               then vol[1] + v

               else Double.NaN;

def GlobeX_Volume = vol;

def ONhigh = if GlobeX and !Globex[1]

             then h

             else if Globex and

                     h > ONhigh[1]

                     then h

                  else ONhigh[1];

def ONhighBar = if GlobeX and h == ONhigh

                then Bar

                else double.nan;

def ONlow = if GlobeX and !GlobeX[1]

            then l

            else if GlobeX and

                    l < ONlow[1]

            then l

                 else ONlow[1];

def ONlowBar = if GlobeX and l == ONlow

               then Bar

               else double.nan;

def OverNightHigh = if BarNumber() == HighestAll(ONhighBar)

                    then ONhigh

                    else OverNightHigh[1];

def OverNightLow = if BarNumber() == HighestAll(ONlowBar)

                   then ONlow

                   else OverNightLow[1];

plot ONH = if OverNightHigh > 0

           then OverNightHigh

           else Double.NaN;

     ONH.SetHiding(!PlotOverNightExtremes);

     ONH.SetPaintingStrategy(PaintingStrategy.SQUARES);

     ONH.SetDefaultColor(Color.BLUE);

     ONH.HideBubble();

     ONH.HideTitle();

plot ONL = if OverNightLow > 0

           then OverNightLow

           else Double.NaN;

     ONL.SetHiding(!PlotOverNightExtremes);

     ONL.SetPaintingStrategy(PaintingStrategy.SQUARES);

     ONL.SetDefaultColor(Color.LIGHT_GRAY);

     ONL.HideBubble();

     ONL.HideTitle();


def MaxBar = Max(HighestAll(ONhighBar), HighestAll(ONlowBar));


plot coeff1 = if HighestAll(ONhighBar) == MaxBar and OverNightLow > 0 and OverNightHigh > 0

              then ((OverNightHigh - OverNightLow) * coeff_1) + OverNightLow

              else if HighestAll(ONlowBar) == MaxBar and OverNightLow > 0 and OverNightHigh > 0

              then OverNightHigh - ((OverNightHigh - OverNightLow) * coeff_1)

              else double.nan;

plot coeff2 = if HighestAll(ONhighBar) == MaxBar and OverNightLow > 0 and OverNightHigh > 0

              then ((OverNightHigh - OverNightLow) * coeff_2) + OverNightLow

               else if HighestAll(ONlowBar) == MaxBar and OverNightLow > 0 and OverNightHigh > 0

              then OverNightHigh - ((OverNightHigh - OverNightLow) * coeff_2)

              else double.nan;

plot coeff3 = if HighestAll(ONhighBar) == MaxBar and OverNightLow > 0 and OverNightHigh > 0

              then ((OverNightHigh - OverNightLow) * coeff_3) + OverNightLow

              else if HighestAll(ONlowBar) == MaxBar and OverNightLow > 0 and OverNightHigh > 0

              then OverNightHigh - ((OverNightHigh - OverNightLow) * coeff_3)

              else double.nan;

plot coeff4 = if HighestAll(ONhighBar) == MaxBar and OverNightLow > 0 and OverNightHigh > 0

              then ((OverNightHigh - OverNightLow) * coeff_4) + OverNightLow

              else if HighestAll(ONlowBar) == MaxBar and OverNightLow > 0 and OverNightHigh > 0

              then OverNightHigh - ((OverNightHigh - OverNightLow) * coeff_4)

              else double.nan;

plot coeff5 = if HighestAll(ONhighBar) == MaxBar and OverNightLow > 0 and OverNightHigh > 0

              then ((OverNightHigh - OverNightLow) * coeff_5) + OverNightLow

              else if HighestAll(ONlowBar) == MaxBar and OverNightLow > 0 and OverNightHigh > 0

              then OverNightHigh - ((OverNightHigh - OverNightLow) * coeff_5)

              else double.nan;

plot coeff6 = if HighestAll(ONhighBar) == MaxBar and OverNightLow > 0 and OverNightHigh > 0

              then ((OverNightHigh - OverNightLow) * coeff_6) + OverNightLow

              else if HighestAll(ONlowBar) == MaxBar and OverNightLow > 0 and OverNightHigh > 0

              then OverNightHigh - ((OverNightHigh - OverNightLow) * coeff_6)

              else double.nan;

# 

# End Code GlobeX High Low with Fibs 

Shareable Link

https://tos.mx/oNY5Yw
 
Last edited:
hey! can you help create a script so a h and l are automatically drawn out? thanks!
 
Last edited:
@Tom4235 I think this is what you're talking about.

Rich (BB code):
# Archive Name: GlobeX or Overnight High / Low v.07.2017
# Archive Section: Support Resistance
# Suggested Tos Name: GlobeX_HighLow_v2017_Mobius
# Archive Date: 5.06.2018 May 6, 2018
# Archive Notes: This looks to be a second version

# GlobeX or Overnight High / Low
# Mobius
# V01.2012
# V07.2017 Replaced Time Brackets with GetTime() function which works better with Mobile

input PlotOverNightExtremes = yes;

def h = high;
def l = low;
def bar = BarNumber();
def GlobeX = GetTime() < RegularTradingStart(GetYYYYMMDD());
def ONhigh = if GlobeX and !Globex[1]
             then h
             else if Globex and
                     h > ONhigh[1]
                  then h
                  else ONhigh[1];
def ONhighBar = if GlobeX and h == ONhigh
                then Bar
                else double.nan;
def ONlow = if GlobeX and !GlobeX[1]
            then l
            else if GlobeX and 
                    l < ONlow[1]
                 then l
                 else ONlow[1];
def ONlowBar = if GlobeX and l == ONlow
               then Bar
               else double.nan;
def OverNightHigh = if BarNumber() == HighestAll(ONhighBar) 
                    then ONhigh
                    else OverNightHigh[1];
def OverNightLow = if BarNumber() == HighestAll(ONlowBar) 
                   then ONlow
                   else OverNightLow[1];
plot ONH = if OverNightHigh > 0
           then OverNightHigh
           else Double.NaN;
ONH.SetHiding(!PlotOverNightExtremes);
ONH.SetPaintingStrategy(PaintingStrategy.SQUARES);
ONH.SetDefaultColor(Color.BLUE);
ONH.HideBubble();
ONH.HideTitle();
plot ONL = if OverNightLow > 0
           then OverNightLow
           else Double.NaN;
ONL.SetHiding(!PlotOverNightExtremes);
ONL.SetPaintingStrategy(PaintingStrategy.SQUARES);
ONL.SetDefaultColor(Color.GRAY);
ONL.HideBubble();
ONL.HideTitle();
AddLabel(GlobeX, "GlobeX Range = " + AsDollars(ONH - ONL), color.white);
AddChartBubble(bar == ONhighBar and PlotOverNightExtremes, ONH, "ONH", Color.BLUE);
AddChartBubble(bar == ONlowBar and PlotOverNightExtremes, ONL, "ONL", Color.GRAY, 0);
Alert((close crosses above ONH) or (close crosses below ONL), "", Alert.Bar, Sound.Bell);
# End Code GlobeX or Overnight High / Low v.07.2017
 
Last edited:
@Tom4235 The labels are hard coded in the script, but you can remove them by commenting ('#' in front) lines 59 and 60:

59 # AddChartBubble(bar == ONhighBar and PlotOverNightExtremes, ONH, "ONH", Color.BLUE);
60 # AddChartBubble(bar == ONlowBar and PlotOverNightExtremes, ONL, "ONL", Color.GRAY, 0);
 
Hey all

Trying to hack together a few different studies, a main component being able to capture the current day's premarket high. I'm unsure how to get this data.

Here's part of something I've found online, but it...doesn't seem to always be accurate. Or when it is it seems just slightly accurate. It's weird.

Code:
def stageOne = RegularTradingEnd(GetYYYYMMDD());
def premarketStart = stageOne[1] <> stageOne;
def stageTwo = SecondsTillTime(930);
def premarketSession = stageTwo > 0;
rec premarketHigh = if premarketStart and premarketSession then high else if high > premarketHigh[1] and premarketSession then high else premarketHigh[1];
 
Code:
input PlotPreMktLinesHrsPastOpen = 0;


def PMhrs = RegularTradingStart (GetYYYYMMDD()) > GetTime();
def RMhrs = RegularTradingStart (GetYYYYMMDD()) < GetTime();
def PMStart = RMhrs[1] and PMhrs;
def PMHigh = CompoundValue(1, if PMStart then high else if PMhrs then Max(high, PMHigh[1]) else PMHigh[1], 0);
def bar = BarNumber();
def highBar = if PMhrs and high == PMHigh then bar else Double.NaN;
def PMHighBar = if bar == HighestAll(highBar) then PMHigh else PMHighBar[1];

plot PMH =  PMHighBar;
 
Might as well add the low and the mid and fix issue with drawing lines on 0. It should be possible I think to eliminate that HighestAll call (expensive). Here's my addition for all this sans a HighestAll fix....

I was actually just thinking about this for my charts...I will modify a bit further to change colors, line types, etc. But nice solution @horserider.

Code:
#
# see https://usethinkscript.com/threads/how-to-get-current-days-premarket-high.695/
#
declare once_per_bar;

input PlotPreMktLinesHrsPastOpen = yes;

def bar = BarNumber();
def nan = Double.NaN;
def vHigh = high;
def vLow = low;

def PMhrs = RegularTradingStart (GetYYYYMMDD()) > GetTime();
def RMhrs = RegularTradingStart (GetYYYYMMDD()) < GetTime();
def PMStart = RMhrs[1] and PMhrs;
def PMHigh = CompoundValue(1, if PMStart then vHigh else if PMhrs then Max(vHigh, PMHigh[1]) else PMHigh[1], 0);
def PMLow = CompoundValue(1, if PMStart then vLow else if PMhrs then Min(vLow, PMLow[1]) else PMLow[1], 0);
def highBar = if PMhrs and vHigh == PMHigh then bar else nan;
def lowBar = if PMhrs and vLow == PMLow then bar else nan;
def PMHighBar = if bar == HighestAll(highBar) then PMHigh else PMHighBar[1];
def PMLowBar = if bar == HighestAll(lowBar) then PMLow else PMLowBar[1];

plot PMH =  if PlotPreMktLinesHrsPastOpen and PMHighBar != 0
            then PMHighBar
            else nan;
plot PML =  if PlotPreMktLinesHrsPastOpen and PMLowBar != 0
            then PMLowBar
            else nan;
plot PMMid = if PlotPreMktLinesHrsPastOpen and PMHighBar != 0 and PMLowBar != 0
             then (PMHighBar+PMLowBar)/2
             else nan;

# end of script
 
tried to make it work. does it only work on a certain time frame? when I put it in I just dont see any changed to chart
 
FYI, both of the above scripts only include overnight prices starting at midnight Eastern time. In other words, they do not include prices from the after market trading up until midnight. In other words, they do not include the entire Globex session.

hey! thank you so much, I am very grateful for your help! just seeing if there's a way to get rid of the ONH/ONL label on the chart and have a label top left corner instead so I can read something like "ONH = 20.89" "ONL = 17.82". Looks really great as is, so if this is not possible, I will be more than happy!!
Replace:
Code:
AddChartBubble(bar == ONhighBar and PlotOverNightExtremes, ONH, "ONH", Color.BLUE);
AddChartBubble(bar == ONlowBar and PlotOverNightExtremes, ONL, "ONL", Color.GRAY, 0);

with:
Code:
AddLabel(yes, "ONH = " + ONH, ONH.TakeValueColor());
AddLabel(yes, "ONL = " + ONL, ONL.TakeValueColor());
 
@RandyR Here is code for entire Globex

Code:
# Globex, RTH and prior RTH High and Low
# Request for JQ 11.8.18
# v0.02 11.12.18 will plot prior RTH during current RTH
# Nube

    # inputs
input bubbles = yes;

    # univerals
def na = Double.NaN;
def bn = BarNumber();
def h  = high;
def l  = low;

Script prior {
# subscript for getting prior value of a BarNumber() defined variable
    input prior = close;
    def   priorOf = if prior != prior[1] then prior[1] else priorOf[1];
    plot  priorBar = priorOf;
}
  
   # variables
def cb   = HighestAll(if !IsNaN(h) then bn else na);
def time = GetTime();
def rts  = RegularTradingStart(GetYYYYMMDD());
def rte  = RegularTradingEnd(GetYYYYMMDD());

def RTH = if   time crosses above rts
          then bn else RTH[1];
def globex = if   time crosses below rte
             then bn else globex[1];
# If you want to include the extended session in Globex, then use globex def below
#def globex = if   time crosses above rte
 #            then bn else globex[1];

def priorRTH    = prior(RTH);
def priorGlobex = prior(globex);
def hRTH  = HighestAll(RTH);
def hGX   = HighestAll(globex);
def hPRTH = HighestAll(priorRTH);
def hPGX  = HighestAll(priorGlobex);

def gXhigh = HighestAll(if   bn >= hGX && bn < hRTH
                        then h else if hRTH < hGX && bn >= hGX
                                    then h else na);
def gXlow = LowestAll(if   bn >= hGX && bn < hRTH
                      then l else if hRTH < hGX && bn >= hGX
                                  then l else na);
def RTHhigh = HighestAll(if   bn >= hRTH && bn < hGX
                         then h else if hGX < hRTH && bn >= hRTH
                                    then h else na);
def RTHlow = LowestAll(if   bn >= hRTH && bn < hGX
                       then l else if hGX < hRTH && bn >= hRTH
                                   then l else na);

def priorRTHhigh = HighestAll(if   bn >= hPRTH
                              &&   bn <  if   hGX < hRTH
                                         then hGX
                                         else hPGX
                              then h else na);
def priorRTHlow = LowestAll(if   bn >= hPRTH
                            &&   bn <  if   hGX < hRTH
                                       then hGX
                                       else hPGX
                            then l else na);
                                  
plot
GlobexHigh = gXhigh;
GlobexHigh.SetDefaultColor(Color.Light_Green);
plot
GlobexLow = gXlow;
GlobexLow.SetDefaultColor(Color.Pink);

plot
HighRTH = RTHhigh;
HighRTH.SetDefaultColor(Color.Green);
plot
LowRTH  = RTHlow;
LowRTH.SetDefaultColor(Color.Red);

plot
PreviousHighRTH = priorRTHhigh;
PreviousHighRTH.SetDefaultColor(Color.Dark_Green);
plot
PreviousLowRTH  = priorRTHlow;
PreviousLowRTH.SetDefaultColor(Color.Dark_Red);

AddChartBubble(bubbles && bn == cb, gXhigh, "Globex High", Color.Light_Green);
AddChartBubble(bubbles && bn == cb, RTHhigh, "RTH High", Color.Green);
AddChartBubble(bubbles && bn == cb, priorRTHhigh, "Previous\n RTH High", Color.Dark_Green);
AddChartBubble(bubbles && bn == cb, gXlow, "Globex Low", Color.Pink,0);
AddChartBubble(bubbles && bn == cb, RTHlow, "RTH Low", Color.Red,0);
AddChartBubble(bubbles && bn == cb, priorRTHlow, "Previous\n RTH Low", Color.Dark_Red,0);
# f/ Globex, RTH and prior RTH High and Low
 
Looking for a suitable after hours scan that doesn't scan intraday or premarket; mostly post market in the event volume increases under my nose.

Code:
#begin
#Hint: Displays After Hours & Pre Market change as a  percentage in custom column.
#WaterFrontTrader

#07/20/12: Initital Release
#08/13/12: Fixed to include pre-market and extended session

#"Show Extended Session" should be active on your chart

def Post = secondsFromTime(1600);
def Pre = secondsTillTime(930);
def Closed  = Post >=0 or Pre>=0;
def DayClose = if (Post>=0,close(period = "Day"),close(period = "Day")[1]);
#NN note:modified close to use ask
def Change = close(priceType = "ASK") - DayClose;
def Percent = round(((close - DayClose)/DayClose)*100);
 
plot change1 = percent;
change1.assignValueColor (color.BLACK);
assignBackgroundColor(if close< dayclose then color.red else if close>dayclose then color.green else color.current);
#end
 
That's already available in ThinkorSwim. Go to the Scan tab > Add Filter > Study > Price Performance > After Hours Percent Change.

iZtryhM.png


From there, you can adjust the Net change and percentage in after-hours trading.
 

Attachments

  • iZtryhM.png
    iZtryhM.png
    76.4 KB · Views: 206
Hey, I have a similar question to the poster above me who is asking if there is a way to set an alert for this study based on a specific coefficient be broken above or below. I would like to be alerted if the stock breaks the premarket high or low in this study. Thanks.
 
@Johnnyboyeh This study has the following coefficients defined:

Code:
input coeff_1 = .236;
input coeff_2 = .327;
input coeff_3 = .500;
input coeff_4 = .618;
input coeff_5 = .789;
input coeff_6 = .882;

Note that some of these coefficients are not fibonacci ratios e.g. .327, .789, .882
I imagine that the author might have wanted those levels for reasons known to him.

Suppose you want to be alerted if the price closes above/below the 50% coefficient, just add the following lines to the end of the study

Alert(close crosses below coeff3, "Below 50% Fib", Alert.Bar, Sound.Ring);
Alert(close crosses above coeff3, "Above 50% Fib", Alert.Bar, Sound.Ding);

Hope this helps
 
Last edited:
Hi i appreciate if you know how plot the high and the low of the last hour of premarket. Thanks in advance for your help.
 

Join useThinkScript to post your question to a community of 21,000+ developers and traders.

Similar threads

Not the exact question you're looking for?

Start a new thread and receive assistance from our community.

87k+ Posts
456 Online
Create Post

Similar threads

Similar threads

The Market Trading Game Changer

Join 2,500+ subscribers inside the useThinkScript VIP Membership Club
  • Exclusive indicators
  • Proven strategies & setups
  • Private Discord community
  • ‘Buy The Dip’ signal alerts
  • Exclusive members-only content
  • Add-ons and resources
  • 1 full year of unlimited support

Frequently Asked Questions

What is useThinkScript?

useThinkScript is the #1 community of stock market investors using indicators and other tools to power their trading strategies. Traders of all skill levels use our forums to learn about scripting and indicators, help each other, and discover new ways to gain an edge in the markets.

How do I get started?

We get it. Our forum can be intimidating, if not overwhelming. With thousands of topics, tens of thousands of posts, our community has created an incredibly deep knowledge base for stock traders. No one can ever exhaust every resource provided on our site.

If you are new, or just looking for guidance, here are some helpful links to get you started.

What are the benefits of VIP Membership?
VIP members get exclusive access to these proven and tested premium indicators: Buy the Dip, Advanced Market Moves 2.0, Take Profit, and Volatility Trading Range. In addition, VIP members get access to over 50 VIP-only custom indicators, add-ons, and strategies, private VIP-only forums, private Discord channel to discuss trades and strategies in real-time, customer support, trade alerts, and much more. Learn all about VIP membership here.
How can I access the premium indicators?
To access the premium indicators, which are plug and play ready, sign up for VIP membership here.
Back
Top