Author states: I’ve been using it for a while, and I think this is a good indicator. Even though it is prepared for accumulation/distribution recognizing phase, but based on my observations, it shows when the trend begins getting stronger.
There are 3 ways to use it. I usually get entry position when :
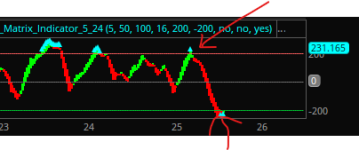
1. Candle upward before / after cross the zero line
2. Candle downward, but real candle is sideways. This will be best when price is in an oversold area.
3. Candle downward and begin to change from big to small. It is usually followed by significant movement.
When down candle with the red real candle is occur, it almost certainly bearish signal.
FYI, I use it in daily chart.
Should be used with any Momentum indicator combination for best results.

Converted from the Matrix Series indicator on TradingView. Brought to you by @diazlaz
There are 3 ways to use it. I usually get entry position when :
1. Candle upward before / after cross the zero line
2. Candle downward, but real candle is sideways. This will be best when price is in an oversold area.
3. Candle downward and begin to change from big to small. It is usually followed by significant movement.
When down candle with the red real candle is occur, it almost certainly bearish signal.
FYI, I use it in daily chart.
Should be used with any Momentum indicator combination for best results.
Converted from the Matrix Series indicator on TradingView. Brought to you by @diazlaz
thinkScript Code
Code:
#Matrix Series for ThinkorSwim V1.0
#
#CREDITS
# glaz
# https://www.tradingview.com/script/2X2cVLhb-Matrix-Series/
#
#CHANGELOG
# 2019.12.06 1.0 @diazlaz - Initial Port
#
#LINKS
# https://www.wisestocktrader.com/indicators/2739-flower-indicator
# https://www.wisestocktrader.com/indicators/1087-matrix-series
#
#
#DESCRIPTION
#There’re 3 ways to use it. I usually get entry position when :
#1. Candle upward before / after cross the zero line
#2. Candle downward but real candle is sideways. This will be best when price is in oversold area.
#3. Candle downward and begin to change from big to small. It is usually followed by significant movement.
#When down candle with the red real candle is occur, it almost certainly bearish signal.
#FYI, I use it in daily chart.
#should be used with any Momentum indicator combination for best results.

declare lower;

#INPUTS
input Smoother = 5;
input SupResPeriod = 50;
input SupResPercentage = 100;
input PricePeriod = 16;
input ob = 200;
input os = -200;
input showColorBars = no; #COLOR BARS
input showDynamics = no; #Dynamic zones
input showOBOS = yes; #Show OB/OS

#LOGIC
def nn = Smoother;
def ys1 = (high + low + close * 2) / 4;
def rk3 = ExpAverage(ys1, nn);
def rk4 = StDev(ys1, nn);
def rk5 = (ys1 - rk3) * 200 / rk4;
def rk6 = ExpAverage(rk5, nn);
def up = ExpAverage(rk6, nn);
def down = ExpAverage(up, nn);
def Oo = If(up < down, up, down);
def Hh = Oo;
def Ll = If(up < down, down, up);
def Cc = Ll;


def Lookback = SupResPeriod;
def PerCent = SupResPercentage;
def Pds = PricePeriod;

def C3 = CCI(length = Pds);

def Osc = C3;
def Value1 = Osc;
def Value2 = Highest(Value1, Lookback);
def Value3 = Lowest(Value1, Lookback);
def Value4 = Value2 - Value3;
def Value5 = Value4 * (PerCent / 100);
def ResistanceLine = Value3 + Value5;
def SupportLine = Value2 - Value5;

#CUSTOM CANDLES
def cUpO;
def cUpH;
def cUpL;
def cUpC;
if up > down
then {
    cUpO = oo;
    cUpH = hh;
    cUpL = ll;
    cUpC = cc;
} else {
    cUpO = Double.NaN;
    cUpH = Double.NaN;
    cUpL = Double.NaN;
    cUpC = Double.NaN;
}

def cDnO;
def cDnH;
def cDnL;
def cDnC;
if up < down
then {
    cDnO = Oo;
    cDnH = Hh;
    cDnL = Ll;
    cDnC = Cc;
} else {
    cdnO = Double.NaN;
    cdnH = Double.NaN;
    cdnL = Double.NaN;
    cdnC = Double.NaN;
}

AddChart(high = cUpH, low = cUpL, open = cUpC, close = cUpO, type = ChartType.CANDLE, COLOR.GREEN);
AddChart(high = cDnH, low = cDnL, open = cDnO, close = cDnC, type = ChartType.CANDLE, COLOR.RED);
AddChart(high = cUpH, low = cUpL, open = cUpO, close = cUpC, type = ChartType.CANDLE, growcolor = COLOR.GREEN);
AddChart(high = cDnH, low = cDnL, open = cDnC, close = cDnO, type = ChartType.CANDLE, growcolor = COLOR.RED);

#COLORBARS
AssignPriceColor(if showColorBars then
 if Oo > Cc then COLOR.RED else if up > down then COLOR.GREEN
 else COLOR.RED
else
  COLOR.CURRENT
);

#PLOTS
plot pResistanceLine = ResistanceLine;
pResistanceLine.SetHiding(!showDynamics);

plot pSupportLine = SupportLine;
pSupportLine.SetHiding(!showDynamics);

def UpShape = if up > ob and up > down then highest(up,1) + 20 else if up > ob and up < down then highest(down,1) + 20 else Double.NaN;

def DownShape = if down < os and up > down then lowest(down,1) - 20 else if
 down < os and up < down then lowest(up,1) - 20 else Double.NaN;

def sState = if !isNan(UpShape) then 100 else if !isNan(DownShape) then -100 else sState[1];

plot pUP = UpShape;
pUP.SetPaintingStrategy(PaintingStrategy.TRIANGLES);
pUP.SetDefaultColor(Color.CYAN);
pUP.SetLineWeight(1);

plot pDown = DownShape;
pDown.SetPaintingStrategy(PaintingStrategy.TRIANGLES);
pDown.SetDefaultColor(Color.CYAN);
pDown.SetLineWeight(1);
;

plot pOB = OB;
pOB.SetHiding(!showOBOS);

plot pOS = OS;
pOS.SetHiding(!showOBOS);
Last edited by a moderator: