The Initial Balance Theory (In Brief)
I recently came across a trading set-up called the initial balance. In essence, you use the first hour of market open to create an 'Opening Range' with the high and low points marked. From there, you can use those points to calculate support/resistance, targets, bias, entries/exits, etc. This gives a more dynamic view of the market on a day to day basis as it takes into consideration the actual traded range for each day, which may be narrower or wider than statically set support/resistance zones can always capture.The Code and Settings
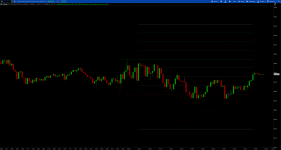
Below is a complete view of all the settings available to toggle or alter easilyAbove is a 5 min chart with the plotted IB Range + both bullish and bearish extensions. The opening range is automatically tracked and updated for the first hour of market open, then at 10:30 the lines become static and the inner and outer quadrant levels are calculated and plotted. It will automatically reset at the beginning of each new market day, track, and plot again. Inner quadrants, bullish extensions, and bearish extensions are all toggleable in the analysis settings. I've also included the option to plot crosses above and below the initial balance levels once they have become static.
At the top of the chart there are a handful of labels that I've added as well to give hard number references for determining stop losses, take profits, or to just give frame for the overall day we're having. I also like to track (for statistical purposes) the Regular Trading Hours (RTH) total range and % move, so I have that coded in this script as well. All of the labels are additionally toggleable to display or hide and will update automatically. Once the initial balance is formed the IB labels will populate and once RTH starts the RTH will update with the new days information. If you want to automatically hide the labels and stop charting the plots at the end of regular trading hours, you can toggle the settings to hide at EOD and the below is what you'll get.
If you're interested in building a range based on a different time period, you can change the IB range begin and end time as well as close time to stop plotting. Below is an example of two IB ranges one based on the 730 to 830 with an end time at 1030 and the second based on 930 to 1030 with an end time at 1600.
For calculating the % move-- I base this on the median price of the currently established range. That's the method that made the most sense to me given that I'm tracking the absolute value of any intraday movement that occurs rather than a positive or negative % move from a static point (say market open or close or at 11:57 etc). Since I trade /ES and SPX it doesn't make a significant difference for my calculations, but it might be more impactful on calculations and be worth considering more if you trade micro or small caps where share price might be significantly smaller.
Something that was important to me was that this indicator had to work on non-standard charts (range, renko, tick, etc.).
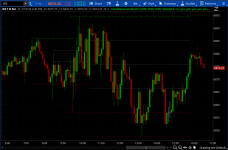
An issue I kept running into is that some chart types aggregate the overnight move all at once and plot them right at open (930) -- most typically range charts on the indexes (i.e. SPX, NDX, etc). This can mess up the calculations for determining the initial balance since the overnight move can show as a high or low given that it's plotted at 930. In the above screenshot you can see a mild example of what that difference can look like (the slight grey highlight is the overnight gap up). The left calculation includes this within the initial balance calculation while the right excludes it.
Below is an example of whenever it can really mess up your entire calculation:
The overnight move here would add almost 20 points to your initial range calculations. To mitigate that, if you switch the secondsfromtime to be greater than just a couple of seconds, it'll ignore all of those overnight bars that plot right at the open. I keep it at 2 seconds, this seems to be enough time to ignore those plots while not missing any RTH plots. It's a niche problem, but since I almost exclusively use range charts it's one that I kept running into, so I included an option to toggle your initial balance indicator to "Range" (with the default being "Standard" for time based charts).
Take Away
I'm sure there are a number of strategies and confluences that you can develop with the IB range looking at different variables. I like using it as dynamic support and resistance levels for entries and targets and the quadrant size for determining my stop loss ranges. I hope this is helpful or useful to someone, I had fun coding it and troubleshooting the various settings that people may want.
Code:
#################################################
# Initial Balance with Quadrants and Extensions #
#################################################

input openTime = 0930;
input OrEnd = 1030;
input closeTime = 1600;
input chartType = {default Standard, Range};
input plotCross = no;
input showIbLabels = yes;
input ShowRthLabels = yes;
input plotInnerQuadrants = yes;
input plotBullishExtensions = no;
input plotBearishExtensions = no;
input hidePlotsAndLabelsAtEod = no;
def na = Double.NaN;

# == Opening Range Calculations and Plots == #
def ORActive;
def RTH;
switch (charttype) {
case Standard:
    ORActive = if GetLastDay() == GetDay() and SecondsFromTime(opentime) >= 0 and SecondsFromTime(ORend) <
0 then 1 else 0;
    RTH = if GetLastDay() == GetDay() and SecondsFromTime(opentime) >= 0 and SecondsFromTime(closeTime) <
0 then 1 else 0;
case Range:
    ORActive = if GetLastDay() == GetDay() and SecondsFromTime(opentime) >= 2 and SecondsFromTime(ORend) <
0 then 1 else 0;
    RTH = if GetLastDay() == GetDay() and SecondsFromTime(opentime) >= 2 and SecondsFromTime(closeTime) <
0 then 1 else 0;
};

def ORHigh = if ORActive then high else na;
def ORLow = if ORActive then low else na;
def ORStaticHigh = if GetLastDay() != GetDay() or SecondsFromTime(ORend) < 0 then na else HighestAll(ORHigh);
def ORStaticLow = if GetLastDay() != GetDay() or SecondsFromTime(ORend) < 0 then na else LowestAll(ORLow);
def stopThePlot = if hidePlotsAndLabelsAtEod then RTH else na;

plot ORAH = if GetLastDay() != GetDay() or !ORActive then na else HighestAll(ORHigh);
plot ORAL = if GetLastDay() != GetDay() or !ORActive then na else LowestAll(ORLow);
plot ORH = if GetLastDay() != GetDay() or SecondsFromTime(ORend) < 0 then na else if hidePlotsAndLabelsAtEod and !RTH then na else HighestAll(ORHigh);
plot ORL = if GetLastDay() != GetDay() or SecondsFromTime(ORend) < 0 then na else if hidePlotsAndLabelsAtEod and !RTH then na else LowestAll(ORLow);
ORAH.SetStyle(Curve.SHORT_DASH);
ORAL.SetStyle(Curve.SHORT_DASH);
ORAH.SetDefaultColor(Color.GREEN);
ORAL.SetDefaultColor(Color.RED);
ORAH.SetLineWeight(1);
ORAL.SetLineWeight(1);
ORAH.hidebubble();
ORAL.hidebubble();
ORAH.hidetitle();
ORAL.hidetitle();
ORH.SetStyle(Curve.MEDIUM_DASH);
ORL.SetStyle(Curve.MEDIUM_DASH);
ORH.SetDefaultColor(createcolor(0, 153, 0));
ORL.SetDefaultColor(createcolor(153, 0, 0));
ORH.SetLineWeight(1);
ORL.SetLineWeight(1);
ORH.hidebubble();
ORL.hidebubble();
ORH.HideTitle();
ORL.HideTitle();

# == Price Crosses IB Range == #
plot CrossORH = if plotCross and (close crosses ORH) then (ORH) else na;
crossORH.setpaintingStrategy(paintingstrategy.squares);
crossORH.setdefaultColor (color.MAGENTA);
crossORH.setlineweight(2);
crossORH.hidebubble();
crossORH.hidetitle();
plot CrossORL = if plotCross and (close crosses ORL) then (ORL) else na;
crossORL.setpaintingStrategy(paintingstrategy.squares);
crossORL.setdefaultColor (color.MAGENTA);
crossORL.setlineweight(2);
crossORL.hidebubble();
crossORL.hidetitle();

# == IB Range Internal Quadrants and Labels == #
def ibRange = ORStaticHigh - ORStaticLow;
def ibQuad = ibrange/4;
def ibPercent = (ibrange/(ORStaticLow + (2*ibquad))) * 100;

plot ibQ1 = if plotInnerQuadrants then ORL + ibquad else na;
plot ibQ2 = if plotInnerQuadrants then ORL + (2*ibquad) else na;
plot ibQ3 = if plotInnerQuadrants then ORL + (3*ibquad) else na;
ibQ1.SetPaintingStrategy(PaintingStrategy.LINE);
ibQ2.SetPaintingStrategy(PaintingStrategy.LINE);
ibQ3.SetPaintingStrategy(PaintingStrategy.LINE);
ibQ1.SetDefaultColor(Color.DARK_GRAY);
ibQ2.SetDefaultColor(Color.DARK_GRAY);
ibQ3.SetDefaultColor(Color.DARK_GRAY);
ibQ1.setLineWeight(1);
ibQ2.setLineWeight(1);
ibQ3.setLineWeight(1);
ibQ1.hidebubble();
ibQ2.hidebubble();
ibQ3.hidebubble();
ibQ1.hidetitle();
ibQ2.hidetitle();
ibQ3.hidetitle();

AddLabel(showIbLabels,
    if !ORActive and !hidePlotsAndLabelsAtEod then "Quadrant Size: " + Round(ibquad,2)
    else if stopThePlot and !ORActive then "Quadrant Size: " + Round(ibquad,2)
    else "",
    if !ORActive and !hidePlotsAndLabelsAtEod then color.GRAY
    else if stopThePlot and !ORActive then color.GRAY
    else color.DARK_GRAY
);
AddLabel(showIbLabels,
    if !ORActive and !hidePlotsAndLabelsAtEod then "IB Range: " + Round(ibrange,2)
    else if stopThePlot and !ORActive then "IB Range: " + Round(ibrange,2)
    else "",
    if !ORActive and !hidePlotsAndLabelsAtEod then color.GRAY
    else if stopThePlot and !ORActive then color.GRAY
    else color.DARK_GRAY
);
AddLabel(showIbLabels,
    if !ORActive and !hidePlotsAndLabelsAtEod then "IB Percent Range: " + Round(ibpercent,2) +"%"
    else if stopThePlot and !ORActive then "IB Percent Range: " + Round(ibpercent,2) +"%"
    else "",
    if !ORActive and !hidePlotsAndLabelsAtEod then color.GRAY
    else if stopThePlot and !ORActive then color.GRAY
    else color.DARK_GRAY
);

# == Bullish and Bearish Extensions == #
plot ibBullQ1 = if plotBullishExtensions then ORH + ibquad else na;
plot ibBullQ2 = if plotBullishExtensions then ORH + (2*ibquad) else na;
plot ibBullQ3 = if plotBullishExtensions then ORH + (3*ibquad) else na;
plot ibBullQ4 = if plotBullishExtensions then ORH + (4*ibquad) else na;
ibBullQ1.SetPaintingStrategy(PaintingStrategy.LINE);
ibBullQ2.SetPaintingStrategy(PaintingStrategy.LINE);
ibBullQ3.SetPaintingStrategy(PaintingStrategy.LINE);
ibBullQ4.SetPaintingStrategy(PaintingStrategy.LINE);
ibBullQ1.SetDefaultColor(createcolor(0, 78, 35));
ibBullQ2.SetDefaultColor(createcolor(0, 78, 35));
ibBullQ3.SetDefaultColor(createcolor(0, 78, 35));
ibBullQ4.SetDefaultColor(Color.GRAY);
ibBullQ1.setLineWeight(1);
ibBullQ2.setLineWeight(1);
ibBullQ3.setLineWeight(1);
ibBullQ4.setLineWeight(1);
ibBullQ1.hidebubble();
ibBullQ2.hidebubble();
ibBullQ3.hidebubble();
ibBullQ4.hidebubble();
ibBullQ1.hidetitle();
ibBullQ2.hidetitle();
ibBullQ3.hidetitle();
ibBullQ4.hidetitle();

plot ibBearQ1 = if plotBearishExtensions then ORL - ibquad else na;
plot ibBearQ2 = if plotBearishExtensions then ORL - (2*ibquad) else na;
plot ibBearQ3 = if plotBearishExtensions then ORL - (3*ibquad) else na;
plot ibBearQ4 = if plotBearishExtensions then ORL - (4*ibquad) else na;
ibBearQ1.SetPaintingStrategy(PaintingStrategy.LINE);
ibBearQ2.SetPaintingStrategy(PaintingStrategy.LINE);
ibBearQ3.SetPaintingStrategy(PaintingStrategy.LINE);
ibBearQ4.SetPaintingStrategy(PaintingStrategy.LINE);
ibBearQ1.SetDefaultColor(createcolor(65, 0, 0));
ibBearQ2.SetDefaultColor(createcolor(65, 0, 0));
ibBearQ3.SetDefaultColor(createcolor(65, 0, 0));
ibBearQ4.SetDefaultColor(Color.GRAY);
ibBearQ1.setLineWeight(1);
ibBearQ2.setLineWeight(1);
ibBearQ3.setLineWeight(1);
ibBearQ4.setLineWeight(1);
ibBearQ1.hidebubble();
ibBearQ2.hidebubble();
ibBearQ3.hidebubble();
ibBearQ4.hidebubble();
ibBearQ1.hidetitle();
ibBearQ2.hidetitle();
ibBearQ3.hidetitle();
ibBearQ4.hidetitle();

# == Regular Trading Hours Range Labels == #
def HOD = if RTH then high else na;
def LOD = if RTH then low else na;
def HighODay = if GetLastDay() != GetDay() then na else HighestAll(HOD);
def LowODay = if GetLastDay() != GetDay() then na else LowestAll(LOD);
def Range = HighODay - LowODay;
def midprice = range/2;
def Percent = (range/(low + midprice)) * 100;
def isrealtime = !isNaN(close);

AddLabel(showRthLabels,
    if isrealtime and !hidePlotsAndLabelsAtEod then "RTH Range: " + Round(range,2)
    else if isrealtime and stopThePlot then "RTH Range: " + Round(range,2)
    else "",
    if isrealtime and !hidePlotsAndLabelsAtEod then (CreateColor(0, 51, 102))
    else if isrealtime and stopThePlot then (CreateColor(0, 51, 102))
    else color.DARK_GRAY
);
AddLabel(showRthLabels,
    if isrealtime and !hidePlotsAndLabelsAtEod then "RTH Percent Range: " + Round(percent,2) +"%"
    else if isrealtime and stopThePlot then "RTH Percent Range: " + Round(percent,2) +"%"
    else "",
    if isrealtime and !hidePlotsAndLabelsAtEod then (CreateColor(0, 51, 102))
    else if isrealtime and stopThePlot then (CreateColor(0, 51, 102))
    else color.DARK_GRAY
);

### End of Code ###