
@dap711 Hi, someone asked about using circles, Dots ? I made some changes ,Hopefully is ok with you if not , admin can take it down.View attachment 25972
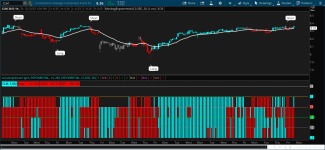
I like my indicators to be easy on the eyes and intuitive just by a quick look. So, here is a volume pressure indicator that not only measures the chart asset, but it calculates the Magnificent 7, QQQ, and SPY. When the colors are all the same enter the trade! Can be used on any time frame.
SQL:declare lower; # ────────────────────────────────────────────────────────────────── # Inputs # ────────────────────────────────────────────────────────────────── input PaintBars = yes; # Volume Pressure Inputs input Volume_AvgType = AverageType.EXPONENTIAL; input Volume_Length = 14; input Volume_AvgLength = 200; # Moving Average Inputs input MovAvg_AvgType = AverageType.EXPONENTIAL; input MovAvg_Price = close; input MovAvg_Length = 20; # ─────────────────────────────────────────────────────────────────────── # Raw Data # ─────────────────────────────────────────────────────────────────────── def vol = volume; def selling = vol * (high - close) / (high - low); def buying = vol * (close - low) / (high - low); def buyV_ma = MovingAverage(Volume_AvgType, buying, Volume_Length); def sellV_ma = MovingAverage(Volume_AvgType, selling, Volume_Length); def MA = MovingAverage(MovAvg_AvgType, MovAvg_Price, MovAvg_Length); addlabel(yes, GetSymbol() +": " + round(buyV_ma - sellV_ma,0), if buyV_ma > sellV_ma then color.cyan else color.red); plot Dot_Cyan = if buyV_ma > sellV_ma and close > MA then 1 else Double.NaN; Dot_Cyan.SetPaintingStrategy(PaintingStrategy.Histogram); Dot_Cyan.SetLineWeight(3); Dot_Cyan.AssignValueColor(Color.CYAN); plot Dot_Red = if buyV_ma < sellV_ma and close < MA then 1 else Double.NaN; Dot_Red.SetPaintingStrategy(PaintingStrategy.Histogram); Dot_Red.SetLineWeight(3); Dot_Red.AssignValueColor(Color.RED); plot pos2Line = 2; plot pos1Line = 1; plot ZeroLine = 0; plot neg1Line = -1; plot neg2Line = -2; AssignPriceColor( if PaintBars and !IsNaN(Dot_Cyan) then Color.CYAN else if PaintBars and !IsNaN(Dot_Red) then Color.RED else Color.GRAY ); # ──────────────────────────────────────────────────────────────────────── # 4) Magnificent Seven aggregate dots at 0/100 # ──────────────────────────────────────────────────────────────────────── script VolumePressure { input sym = "AAPL"; def o = open(sym); def h = high(sym); def l = low(sym); def c = close(sym); def v = volume(sym); def uw = if c>o then h-c else h-o; def lw = if c>o then o-l else c-l; def sp = h - l; def bd = sp - (uw + lw); def pctB= bd / sp; def pctW= (uw + lw) / sp; def buyR = if c>o then (pctB + pctW/2) * v else (pctW/2) * v; def sellR = if c<o then (pctB + pctW/2) * v else (pctW/2) * v; plot Buy = MovingAverage(AverageType.EXPONENTIAL, buyR, 14); plot Sell = MovingAverage(AverageType.EXPONENTIAL, sellR, 14); } def avgBuy = ( VolumePressure("AAPL").Buy + VolumePressure("MSFT").Buy + VolumePressure("GOOGL").Buy + VolumePressure("AMZN").Buy + VolumePressure("META").Buy + VolumePressure("TSLA").Buy + VolumePressure("NVDA").Buy ) / 7; def avgSell = ( VolumePressure("AAPL").Sell + VolumePressure("MSFT").Sell + VolumePressure("GOOGL").Sell + VolumePressure("AMZN").Sell + VolumePressure("META").Sell + VolumePressure("TSLA").Sell + VolumePressure("NVDA").Sell ) / 7; addlabel(yes, "Mag 7: " + round(avgBuy - avgSell,0), if avgBuy > avgSell then color.cyan else color.red); plot Cyan_M7 = if avgBuy > avgSell then -1 else Double.NaN; Cyan_M7.SetPaintingStrategy(PaintingStrategy.Histogram); Cyan_M7.SetLineWeight(3); Cyan_M7.AssignValueColor(Color.CYAN); plot Red_M7 = if avgBuy < avgSell then -1 else Double.NaN; Red_M7.SetPaintingStrategy(PaintingStrategy.Histogram); Red_M7.SetLineWeight(3); Red_M7.AssignValueColor(Color.RED); def qqqBuy = VolumePressure("QQQ").Buy; def qqqSell = VolumePressure("QQQ").Sell; addlabel(yes, "QQQ: " + round(qqqBuy - qqqSell,0), if qqqBuy > qqqSell then color.cyan else color.red); plot Cyan_QQQ = if qqqBuy > qqqSell then -2 else Double.NaN; Cyan_QQQ.SetPaintingStrategy(PaintingStrategy.Histogram); Cyan_QQQ.SetLineWeight(3); Cyan_QQQ.AssignValueColor(Color.CYAN); plot Red_QQQ = if qqqBuy < qqqSell then -2 else Double.NaN; Red_QQQ.SetPaintingStrategy(PaintingStrategy.Histogram); Red_QQQ.SetLineWeight(3); Red_QQQ.AssignValueColor(Color.RED); def spyBuy = VolumePressure("SPY").Buy; def spySell = VolumePressure("SPY").Sell; addlabel(yes, "SPY: " + round(spyBuy - spySell,0), if spyBuy > spySell then color.cyan else color.red); plot Cyan_SPY = if spyBuy > spySell then -3 else Double.NaN; Cyan_SPY.SetPaintingStrategy(PaintingStrategy.Histogram); Cyan_SPY.SetLineWeight(3); Cyan_SPY.AssignValueColor(Color.CYAN); plot Red_SPY = if spyBuy < spySell then -3 else Double.NaN; Red_SPY.SetPaintingStrategy(PaintingStrategy.Histogram); Red_SPY.SetLineWeight(3); Red_SPY.AssignValueColor(Color.RED);
View attachment 25972
You are using an out of date browser. It may not display this or other websites correctly.
You should upgrade or use an alternative browser.
You should upgrade or use an alternative browser.
Volume Pressure in a whole new light for ThinkOrSwim
- Thread starter dap711
- Start date
@dap711 Hi, someone asked about using circles, Dots ? I made some changes ,Hopefully is ok with you if not , admin can take it down.
Instead of using "0" for the new bar, you might want to use "-3"
I believe-3 is SPY?
Original code:I believe-3 is SPY?
plot pos2Line = 2; (blank line for labels)
plot pos1Line = 1; (Current chart asset)
plot ZeroLine = 0; (Mag7)
plot neg1Line = -1; (QQQ)
plot neg2Line = -2; (SPY)
It makes the indicator easier to read if the above are kept together.
So you would add a new line -3 and plot on -4. Just a suggestion.
@dap711 @cando13579
The reason for the dots version is that I like to throw another simple overlap indictor on top of it.
It just keeps me in check to make sure that I'm following my own trading rules.
Sometimes, I forget my own trading rules and I hit that "BUY" button at the wrong time!
I like the SIGNAL labels. I'm all about labels as it helps me keeps in check and I can quickly glance at it. I have a lot of labels that are comments and numerical data. I like to see the numbers move up and down, and make my decision on when to buy or sell.
Why include both the Mag7 and QQQ? Mag7 makes up over 44% of QQQ, so you're essentially double-weighting tech.
Also, why compare a non-tech stock against a tech basket? If you want to look at WMT, you don't really care what tech stocks are doing--except maybe in an anti-correlated way, as sector rotation might move stocks out of tech and into staples, etc.
Also, why compare a non-tech stock against a tech basket? If you want to look at WMT, you don't really care what tech stocks are doing--except maybe in an anti-correlated way, as sector rotation might move stocks out of tech and into staples, etc.
I can tell you haven't used the indicator yet.Why include both the Mag7 and QQQ? Mag7 makes up over 44% of QQQ, so you're essentially double-weighting tech.
Also, why compare a non-tech stock against a tech basket? If you want to look at WMT, you don't really care what tech stocks are doing--except maybe in an anti-correlated way, as sector rotation might move stocks out of tech and into staples, etc.
")
Why include both the Mag7 and QQQ in this indicator?
 They aren’t the same thing — even if they’re correlated.
The Mag7 is a custom aggregation of the seven largest tech stocks (AAPL, MSFT, GOOGL, AMZN, META, TSLA, NVDA) averaged together in the script. QQQ is a market-cap-weighted ETF made up of the largest 100 Nasdaq stocks — not just those seven.
So:
- Mag7 gives a pure view of mega-cap tech consensus (equal-weighted average of those leaders in the script).
- QQQ gives the broad tech/innovation trend as seen through a real ETF (with heavy—but not exclusive—tech bias).
✔ Mag7 can diverge from the wider Nasdaq.
✔ QQQ includes semis, software, biotech, etc., beyond the Magnificent 7. StockCharts
So Mag7 + QQQ together is a way to check both tech-core leaders and broader market/tech trend strength.
Does this double-weight tech?
 Yes, it implicitly adds tech bias — but that’s intentional in the indicator’s design.
— the stated goal is to find confluence of volume pressure across the instrument you’re trading plus the dominant market drivers (Mag7, QQQ, SPY).
Think of it like:
From a risk-management perspective this does overweight tech exposure — but that’s the premise of the indicator rather than a coding mistake.“If the thing I want to trade, the mega leaders, broad tech, and the overall market all agree on direction, then signal strength is higher.”
But why compare non-tech stocks (like WMT) to Mag7/QQQ at all?
This is where it gets more subjective — and where your question makes good sense.
There are two distinct analytical goals that people mix up:
1) Correlation/confirmation in short-term trading
Traders will sometimes check a market leader or broad market benchmark to confirm direction even for unrelated stocks.
Example: If the market and tech leaders are trending down on volume pressure, a weak-relative stock might be less trustworthy to go long. Same in reverse.
This isn’t fundamentally logical — it’s practically tactical:
- Traders believe cross-market volume signals reflect risk appetite.
- Broad market strength/weakness tends to influence most stocks (even staples to some degree).
2) Sector rotation context
If you’re analyzing something like WMT for sector-rotation reasons, then sure — tech weakness could be relevant (people moving from tech into staples), but that’s a different type of relationship.
✔ Anti-correlation or rotation dynamics matter.
Meaning: if QQQ is weakening and volume pressure in staples is rising, that’s a different trade signal than QQQ simply being strong with WMT weak.
But the indicator in the thread doesn’t explicitly model rotation or anti-correlation — it only looks for alignment (all signals the same). If the market is rotating, that alignment won’t happen — and this indicator won’t capture that nuance well.
So what’s the real takeaway?
 Including Mag7 + QQQ is not a “mistake.” It’s a deliberate way to layer pure mega-cap tech direction with broad tech ETF trend and overall market (SPY) to filter signals. But yes — it does inherently overweight tech biases, especially in a market where the Magnificent Seven are dominant. Therefore — for non-tech stocks like WMT, you might prefer sector-specific context (e.g., consumer staples indices, sector volume signals, rotation indicators) over tech-centric metrics.
Better alternatives for non-tech context
If your goal is to analyze a stock like Walmart (WMT), consider:
- Volume pressure for sector ETFs (XLP for staples).
- Relative strength vs broad market.
- Momentum/volume signals for the stock itself rather than tech benchmarks.
- Sector rotation indicators (e.g., comparing XLP vs XLK).
In short:
The indicator intentionally layers multiple market views — which gives tech-heavy context rather than neutral analysis. For tech stocks that may be useful; for non-tech it may overemphasize unrelated drivers.
To sum it up, I created this indicator for the way I trade and decided to share it.
Last edited by a moderator:
Still practice trading it and it has been pretty phenomenal used in conjunction with my trading strategy. There are obvious things to look at before entering long or short such as seeing the buy/sell signal at a peak or trough. Also, looking at the buy/sell where the security is consolidating and if an entry is warranted. Again, if used in conjunction with other indicators or candlestick patterns it performs very well. Maybe, if there was a selloff in tech signals might be more difficult, but in that case the overall market would like trend downward as well preventing a buy signal from occurring. I'll keep practice trades with it until February and see if it continues to perform as well as it has in the short time I've added it to my chart indicators.I can tell you haven't used the indicator yet.
Why include both the Mag7 and QQQ in this indicator?
The Mag7 is a custom aggregation of the seven largest tech stocks (AAPL, MSFT, GOOGL, AMZN, META, TSLA, NVDA) averaged together in the script. QQQ is a market-cap-weighted ETF made up of the largest 100 Nasdaq stocks — not just those seven.
So:
Even though Mag7 dominate QQQ (around ~38–40%+ of its weighting in real markets), their signals aren’t identical:
- Mag7 gives a pure view of mega-cap tech consensus (equal-weighted average of those leaders in the script).
- QQQ gives the broad tech/innovation trend as seen through a real ETF (with heavy—but not exclusive—tech bias).
✔ Mag7 can diverge from the wider Nasdaq.
✔ QQQ includes semis, software, biotech, etc., beyond the Magnificent 7. StockCharts
So Mag7 + QQQ together is a way to check both tech-core leaders and broader market/tech trend strength.
Does this double-weight tech?
— the stated goal is to find confluence of volume pressure across the instrument you’re trading plus the dominant market drivers (Mag7, QQQ, SPY).
Think of it like:
From a risk-management perspective this does overweight tech exposure — but that’s the premise of the indicator rather than a coding mistake.
But why compare non-tech stocks (like WMT) to Mag7/QQQ at all?
This is where it gets more subjective — and where your question makes good sense.
There are two distinct analytical goals that people mix up:
1) Correlation/confirmation in short-term trading
Traders will sometimes check a market leader or broad market benchmark to confirm direction even for unrelated stocks.
Example: If the market and tech leaders are trending down on volume pressure, a weak-relative stock might be less trustworthy to go long. Same in reverse.
This isn’t fundamentally logical — it’s practically tactical:
So mag7/QQQ here act as market “context filters” — not as direct predictors of something like WMT.
- Traders believe cross-market volume signals reflect risk appetite.
- Broad market strength/weakness tends to influence most stocks (even staples to some degree).
2) Sector rotation context
If you’re analyzing something like WMT for sector-rotation reasons, then sure — tech weakness could be relevant (people moving from tech into staples), but that’s a different type of relationship.
✔ Anti-correlation or rotation dynamics matter.
Meaning: if QQQ is weakening and volume pressure in staples is rising, that’s a different trade signal than QQQ simply being strong with WMT weak.
But the indicator in the thread doesn’t explicitly model rotation or anti-correlation — it only looks for alignment (all signals the same). If the market is rotating, that alignment won’t happen — and this indicator won’t capture that nuance well.
So what’s the real takeaway?
Better alternatives for non-tech context
If your goal is to analyze a stock like Walmart (WMT), consider:
That gives you context where tech isn’t dominating the signal.
- Volume pressure for sector ETFs (XLP for staples).
- Relative strength vs broad market.
- Momentum/volume signals for the stock itself rather than tech benchmarks.
- Sector rotation indicators (e.g., comparing XLP vs XLK).
In short:
The indicator intentionally layers multiple market views — which gives tech-heavy context rather than neutral analysis. For tech stocks that may be useful; for non-tech it may overemphasize unrelated drivers.
To sum it up, I created this indicator for the way I trade and decided to share it.
To my view, it's an excellent indicator when used with others for confluence. Just one use case--I tracked it for SPY on the 5D3M using an AGAIG chart (credit to @csricksdds). When the AGAIG long-short bubble fired (and keep in mind that it re-paints) and the other AGAIG indicators kicked in (vertical green/red bar etc), I would only take the trade if at least 3 of the 4 Volume Pressure bars were in the same direction. The results were very good....also I noticed that even if the bars were all the same color, the price could reverse very sharply (to my mind stop-hunting by the MMs but I could be wrong) but the sustained move would eventually come. I would say that this is among the best indicators on the entire UTS forum, as I trade SPY and QQQ frequently. I am not sure how effective it may be for other instruments.Still practice trading it and it has been pretty phenomenal used in conjunction with my trading strategy. There are obvious things to look at before entering long or short such as seeing the buy/sell signal at a peak or trough. Also, looking at the buy/sell where the security is consolidating and if an entry is warranted. Again, if used in conjunction with other indicators or candlestick patterns it performs very well. Maybe, if there was a selloff in tech signals might be more difficult, but in that case the overall market would like trend downward as well preventing a buy signal from occurring. I'll keep practice trades with it until February and see if it continues to perform as well as it has in the short time I've added it to my chart indicators.
Last edited:
I’m glad you mentioned your focus on SPY/QQQ since they’re mine too (including leveraged long & short). Big thanks to @dap711 for the work on this and his service to the US!To my view, it's an excellent indicator when used with others for confluence. Just one use case--I tracked it for SPY on the 5D3M using an AGAIG chart (credit to @csricksdds). When the AGAIG long-short bubble fired (and keep in mind that it re-paints) and the other AGAIG indicators kicked in (vertical green/red bar etc), I would only take the trade if at least 3 of the 4 Volume Pressure bars were in the same direction. The results were very good....also I noticed that even if the bars were all the same color, the price could reverse every sharply (to my mind stop-hunting by the MMs but I could be wrong) but the sustained move would eventually come. I would say that this is among the best indicators on the entire UTS forum, as I trade SPY and QQQ frequently. I am not sure how effective it may be for other instruments.
hogsfeathers
New member
Thanks for taking it out for a spin!thanks! I use it with the 20 EMA and the As good as it gets! from this site.
Last edited:
stockdaddy
New member
Well done! Creating this indicator pulls together many missing (unobserved) aspects of trading. I am an adamant believer that volume plays a paramount role in confirming current conditions.Thanks for taking it out for a spin!
I have a general question. I trade /ES futures and do so mostly in the overnight session. (no pattern day trading rules). I always reference the price movement for the Dow (/YM), the Nasdaq (/NQ) and the VIX futures (/VX). These markets move slower at night and usually have lower volume than during the cash session. Futures are liquid enough during overnight where I don't really have to worry about that wide of spreads.
Overnight trading, I'm not too concerned about the Mag7 (at least not yet until full 24/5 trading is approved)
How hard would it be to modify this indicator to choose not to look at Mag7 and also replace the SPY & QQQ with /ES and /NQ?
I have done some Thinkscript coding and could take a blind stab at modifying it myself but would greatly appreciate your suggestions on how to modify the code so I don't make a travesty of the whole thing
Thank you again for sharing your insights within the code you have provided.
Well done! Creating this indicator pulls together many missing (unobserved) aspects of trading. I am an adamant believer that volume plays a paramount role in confirming current conditions.
I have a general question. I trade /ES futures and do so mostly in the overnight session. (no pattern day trading rules). I always reference the price movement for the Dow (/YM), the Nasdaq (/NQ) and the VIX futures (/VX). These markets move slower at night and usually have lower volume than during the cash session. Futures are liquid enough during overnight where I don't really have to worry about that wide of spreads.
Overnight trading, I'm not too concerned about the Mag7 (at least not yet until full 24/5 trading is approved)
How hard would it be to modify this indicator to choose not to look at Mag7 and also replace the SPY & QQQ with /ES and /NQ?
I have done some Thinkscript coding and could take a blind stab at modifying it myself but would greatly appreciate your suggestions on how to modify the code so I don't make a travesty of the whole thing
Thank you again for sharing your insights within the code you have provided.
Volume Pressure v.2.0
Ruby:
declare lower;

# ──────────────────────────────────────────────────────────────────
#  Inputs
# ──────────────────────────────────────────────────────────────────
input PaintBars         = yes;

# Volume Pressure Inputs
input Volume_AvgType    = AverageType.EXPONENTIAL;
input Volume_Length     = 14;

# Moving Average Inputs
input MovAvg_AvgType    = AverageType.EXPONENTIAL;
input MovAvg_Price      = close;
input MovAvg_Length     = 20;
input Symbol_1          = "/YM";
input Symbol_2          = "/NQ";
input Symbol_3          = "/VX";

# ───────────────────────────────────────────────────────────────────────
#  Raw Data
# ───────────────────────────────────────────────────────────────────────
def vol        = volume;
def selling    = vol * (high - close) / (high - low);
def buying     = vol * (close - low) / (high - low);

def buyV_ma   = MovingAverage(Volume_AvgType, buying, Volume_Length);
def sellV_ma  = MovingAverage(Volume_AvgType, selling, Volume_Length);

def MA        = MovingAverage(MovAvg_AvgType, MovAvg_Price, MovAvg_Length);

addlabel(yes, GetSymbol() +": " + round(buyV_ma - sellV_ma,0), if buyV_ma > sellV_ma then color.cyan else color.red);

plot Dot_Cyan = if buyV_ma > sellV_ma and close > MA then 1 else Double.NaN;
Dot_Cyan.SetPaintingStrategy(PaintingStrategy.Histogram);
Dot_Cyan.SetLineWeight(3);
Dot_Cyan.AssignValueColor(Color.CYAN);

plot Dot_Red  = if buyV_ma < sellV_ma and close < MA then 1 else Double.NaN;
Dot_Red.SetPaintingStrategy(PaintingStrategy.Histogram);
Dot_Red.SetLineWeight(3);
Dot_Red.AssignValueColor(Color.RED);

plot pos1Line = 1;
plot ZeroLine = 0;
plot neg1Line = -1;
plot neg2Line = -2;
plot neg3Line = -3;

AssignPriceColor(
    if PaintBars and !IsNaN(Dot_Cyan) then Color.CYAN
    else if PaintBars and !IsNaN(Dot_Red) then Color.RED
    else Color.GRAY
);

script VolumePressure {
    input sym = "AAPL";
    def o = open(sym);
    def h = high(sym);
    def l = low(sym);
    def c = close(sym);
    def v = volume(sym);

    def uw  = if c>o then h-c else h-o;
    def lw  = if c>o then o-l else c-l;
    def sp  = h - l;
    def bd  = sp - (uw + lw);
    def pctB= bd / sp;
    def pctW= (uw + lw) / sp;

    def buyR  = if c>o then (pctB + pctW/2) * v else (pctW/2) * v;
    def sellR = if c<o then (pctB + pctW/2) * v else (pctW/2) * v;

    plot Buy  = MovingAverage(AverageType.EXPONENTIAL, buyR, 14);
    plot Sell = MovingAverage(AverageType.EXPONENTIAL, sellR, 14);
}

def sym1Buy  = VolumePressure(Symbol_1).Buy;
def sym1Sell = VolumePressure(Symbol_1).Sell;
addlabel(yes, Symbol_1 + ": " + round(sym1Buy - sym1Sell,0), if sym1Buy > sym1Sell then color.cyan else color.red);
plot Cyan_sym1 = if sym1Buy > sym1Sell then -1 else Double.NaN;
Cyan_sym1.SetPaintingStrategy(PaintingStrategy.Histogram);
Cyan_sym1.SetLineWeight(3);
Cyan_sym1.AssignValueColor(Color.CYAN);
plot Red_sym1  = if sym1Buy < sym1Sell then -1 else Double.NaN;
Red_sym1.SetPaintingStrategy(PaintingStrategy.Histogram);
Red_sym1.SetLineWeight(3);
Red_sym1.AssignValueColor(Color.RED);

def sym2Buy  = VolumePressure(Symbol_2).Buy;
def sym2Sell = VolumePressure(Symbol_2).Sell;
addlabel(yes, Symbol_2 + ": " + round(sym2Buy - sym2Sell,0), if sym2Buy > sym2Sell then color.cyan else color.red);
plot Cyan_sym2 = if sym2Buy > sym2Sell then -2 else Double.NaN;
Cyan_sym2.SetPaintingStrategy(PaintingStrategy.Histogram);
Cyan_sym2.SetLineWeight(3);
Cyan_sym2.AssignValueColor(Color.CYAN);
plot Red_sym2  = if sym2Buy < sym2Sell then -2 else Double.NaN;
Red_sym2.SetPaintingStrategy(PaintingStrategy.Histogram);
Red_sym2.SetLineWeight(3);
Red_sym2.AssignValueColor(Color.RED);

def sym3Buy  = VolumePressure(Symbol_3).Buy;
def sym3Sell = VolumePressure(Symbol_3).Sell;
addlabel(yes, Symbol_3 + ": " + round(sym3Buy - sym3Sell,0), if sym3Buy > sym3Sell then color.cyan else color.red);
plot Cyan_sym3 = if sym3Buy > sym3Sell then -3 else Double.NaN;
Cyan_sym3.SetPaintingStrategy(PaintingStrategy.Histogram);
Cyan_sym3.SetLineWeight(3);
Cyan_sym3.AssignValueColor(Color.CYAN);
plot Red_sym3  = if sym3Buy < sym3Sell then -3 else Double.NaN;
Red_sym3.SetPaintingStrategy(PaintingStrategy.Histogram);
Red_sym3.SetLineWeight(3);
Red_sym3.AssignValueColor(Color.RED);
Last edited:
What is that indicator that shows the long/short labels?thanks! I use it with the 20 EMA and the As good as it gets! from this site.
Found here: AGAIGWhat is that indicator that shows the long/short labels?
Careful with it .. it repaints.
Hi,
I loaded file (volume -pressure_ghla..) to TOS software and got the indicator .
I am confused on some items and ask for your explanation of those line.
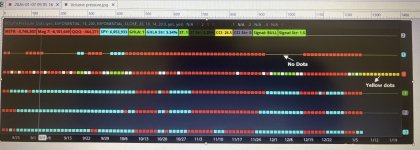
2- sometimes dots and no dots. What is it called?
1- has some yellow/ green/ white. What is is it? What are yellow dots at the end?
0- is the current chart
-1 is Mag7
-2 is QQQ
-3 is SPY
Thank you
I loaded file (volume -pressure_ghla..) to TOS software and got the indicator .
I am confused on some items and ask for your explanation of those line.
2- sometimes dots and no dots. What is it called?
1- has some yellow/ green/ white. What is is it? What are yellow dots at the end?
0- is the current chart
-1 is Mag7
-2 is QQQ
-3 is SPY
Thank you
Attachments
Hi,
I loaded file (volume -pressure_ghla..) to TOS software and got the indicator .
I am confused on some items and ask for your explanation of those line.
2- sometimes dots and no dots. What is it called?
1- has some yellow/ green/ white. What is is it? What are yellow dots at the end?
0- is the current chart
-1 is Mag7
-2 is QQQ
-3 is SPY
Thank you
This is not the indicator that was developed by me or meant for this thread. It was an attempt by another user to enhance the original. I would recommend using the code from the first post.
I spent hours composing and documenting the usage of the indicator, which has been posted HERE. It's kind of heart breaking to read these questions, when the answers to all of them can be found in this thread.
Last edited:
View attachment 25972
I like my indicators to be easy on the eyes and intuitive just by a quick look. So, here is a volume pressure indicator that not only measures the chart asset, but it calculates the Magnificent 7, QQQ, and SPY. When the colors are all the same enter the trade! Can be used on any time frame.
SQL:declare lower; # ────────────────────────────────────────────────────────────────── # Inputs # ────────────────────────────────────────────────────────────────── input PaintBars = yes; # Volume Pressure Inputs input Volume_AvgType = AverageType.EXPONENTIAL; input Volume_Length = 14; input Volume_AvgLength = 200; # Moving Average Inputs input MovAvg_AvgType = AverageType.EXPONENTIAL; input MovAvg_Price = close; input MovAvg_Length = 20; # ─────────────────────────────────────────────────────────────────────── # Raw Data # ─────────────────────────────────────────────────────────────────────── def vol = volume; def selling = vol * (high - close) / (high - low); def buying = vol * (close - low) / (high - low); def buyV_ma = MovingAverage(Volume_AvgType, buying, Volume_Length); def sellV_ma = MovingAverage(Volume_AvgType, selling, Volume_Length); def MA = MovingAverage(MovAvg_AvgType, MovAvg_Price, MovAvg_Length); addlabel(yes, GetSymbol() +": " + round(buyV_ma - sellV_ma,0), if buyV_ma > sellV_ma then color.cyan else color.red); plot Dot_Cyan = if buyV_ma > sellV_ma and close > MA then 1 else Double.NaN; Dot_Cyan.SetPaintingStrategy(PaintingStrategy.Histogram); Dot_Cyan.SetLineWeight(3); Dot_Cyan.AssignValueColor(Color.CYAN); plot Dot_Red = if buyV_ma < sellV_ma and close < MA then 1 else Double.NaN; Dot_Red.SetPaintingStrategy(PaintingStrategy.Histogram); Dot_Red.SetLineWeight(3); Dot_Red.AssignValueColor(Color.RED); plot pos2Line = 2; plot pos1Line = 1; plot ZeroLine = 0; plot neg1Line = -1; plot neg2Line = -2; AssignPriceColor( if PaintBars and !IsNaN(Dot_Cyan) then Color.CYAN else if PaintBars and !IsNaN(Dot_Red) then Color.RED else Color.GRAY ); # ──────────────────────────────────────────────────────────────────────── # 4) Magnificent Seven aggregate dots at 0/100 # ──────────────────────────────────────────────────────────────────────── script VolumePressure { input sym = "AAPL"; def o = open(sym); def h = high(sym); def l = low(sym); def c = close(sym); def v = volume(sym); def uw = if c>o then h-c else h-o; def lw = if c>o then o-l else c-l; def sp = h - l; def bd = sp - (uw + lw); def pctB= bd / sp; def pctW= (uw + lw) / sp; def buyR = if c>o then (pctB + pctW/2) * v else (pctW/2) * v; def sellR = if c<o then (pctB + pctW/2) * v else (pctW/2) * v; plot Buy = MovingAverage(AverageType.EXPONENTIAL, buyR, 14); plot Sell = MovingAverage(AverageType.EXPONENTIAL, sellR, 14); } def avgBuy = ( VolumePressure("AAPL").Buy + VolumePressure("MSFT").Buy + VolumePressure("GOOGL").Buy + VolumePressure("AMZN").Buy + VolumePressure("META").Buy + VolumePressure("TSLA").Buy + VolumePressure("NVDA").Buy ) / 7; def avgSell = ( VolumePressure("AAPL").Sell + VolumePressure("MSFT").Sell + VolumePressure("GOOGL").Sell + VolumePressure("AMZN").Sell + VolumePressure("META").Sell + VolumePressure("TSLA").Sell + VolumePressure("NVDA").Sell ) / 7; addlabel(yes, "Mag 7: " + round(avgBuy - avgSell,0), if avgBuy > avgSell then color.cyan else color.red); plot Cyan_M7 = if avgBuy > avgSell then -1 else Double.NaN; Cyan_M7.SetPaintingStrategy(PaintingStrategy.Histogram); Cyan_M7.SetLineWeight(3); Cyan_M7.AssignValueColor(Color.CYAN); plot Red_M7 = if avgBuy < avgSell then -1 else Double.NaN; Red_M7.SetPaintingStrategy(PaintingStrategy.Histogram); Red_M7.SetLineWeight(3); Red_M7.AssignValueColor(Color.RED); def qqqBuy = VolumePressure("QQQ").Buy; def qqqSell = VolumePressure("QQQ").Sell; addlabel(yes, "QQQ: " + round(qqqBuy - qqqSell,0), if qqqBuy > qqqSell then color.cyan else color.red); plot Cyan_QQQ = if qqqBuy > qqqSell then -2 else Double.NaN; Cyan_QQQ.SetPaintingStrategy(PaintingStrategy.Histogram); Cyan_QQQ.SetLineWeight(3); Cyan_QQQ.AssignValueColor(Color.CYAN); plot Red_QQQ = if qqqBuy < qqqSell then -2 else Double.NaN; Red_QQQ.SetPaintingStrategy(PaintingStrategy.Histogram); Red_QQQ.SetLineWeight(3); Red_QQQ.AssignValueColor(Color.RED); def spyBuy = VolumePressure("SPY").Buy; def spySell = VolumePressure("SPY").Sell; addlabel(yes, "SPY: " + round(spyBuy - spySell,0), if spyBuy > spySell then color.cyan else color.red); plot Cyan_SPY = if spyBuy > spySell then -3 else Double.NaN; Cyan_SPY.SetPaintingStrategy(PaintingStrategy.Histogram); Cyan_SPY.SetLineWeight(3); Cyan_SPY.AssignValueColor(Color.CYAN); plot Red_SPY = if spyBuy < spySell then -3 else Double.NaN; Red_SPY.SetPaintingStrategy(PaintingStrategy.Histogram); Red_SPY.SetLineWeight(3); Red_SPY.AssignValueColor(Color.RED);
View attachment 25972
I have some questions. I installed volume-pressure_ghla-combo, and so far I really like it. I'm paper trading with it now and it seems to be working for me, but I'm confused a bit on what all the info stands for.@dap711 Hi, someone asked about using circles, Dots ? I made some changes ,Hopefully is ok with you if not , admin can take it down.
I've read the writeup submitted, and get that the top line (#2) doesn't have anything on it. Top Line (#1) is for the equity you are looking at (in my case it will be SPY), the ZERO Line I don't know what it is.
Line (#-1) is for the Mag 7
Line (#-2) is for the QQQ
Line (#-3) is for the SPY
Attached is a snipit I took of what I'm looking at.
Q1) The first box is CYAN and shows SPY at 33,750. The 4th box is also SPY but is RED and shows -29602. What is the different meanings of these two boxes? The first box changes to the different equity I may look at.
Q2) What is the (0-Line for)?
Q3) Can you explain what each of the boxes stand for please? ex: What is GHLA and CCI? I'm assuming the Signal Strength boxes are for values between 0 - 1.0 with any higher number being stronger?
Q4) You stated that this works with any time frame. I'm using a 5-min chart. Is 5-min too noisy or would a 10-min chart be better to use for day trading?
Thank you so much for putting this out there. I'm really excited to begin using it in earnest.
Attachments
Sorry .. I don't support that version of the indicator.I have some questions. I installed volume-pressure_ghla-combo, and so far I really like it. I'm paper trading with it now and it seems to be working for me, but I'm confused a bit on what all the info stands for.
I've read the writeup submitted, and get that the top line (#2) doesn't have anything on it. Top Line (#1) is for the equity you are looking at (in my case it will be SPY), the ZERO Line I don't know what it is.
Line (#-1) is for the Mag 7
Line (#-2) is for the QQQ
Line (#-3) is for the SPY
Attached is a snipit I took of what I'm looking at.
Q1) The first box is CYAN and shows SPY at 33,750. The 4th box is also SPY but is RED and shows -29602. What is the different meanings of these two boxes? The first box changes to the different equity I may look at.
Q2) What is the (0-Line for)?
Q3) Can you explain what each of the boxes stand for please? ex: What is GHLA and CCI? I'm assuming the Signal Strength boxes are for values between 0 - 1.0 with any higher number being stronger?
Q4) You stated that this works with any time frame. I'm using a 5-min chart. Is 5-min too noisy or would a 10-min chart be better to use for day trading?
Thank you so much for putting this out there. I'm really excited to begin using it in earnest.
Join useThinkScript to post your question to a community of 21,000+ developers and traders.
| Thread starter | Similar threads | Forum | Replies | Date |
|---|---|---|---|---|
|
|
JAT Buy/Sell Volume Pressure Indicator For ThinkOrSwim | Custom | 26 | |
| S | Global Markets Volume Profile for Intraday Trading for ThinkOrSwim | Custom | 0 | |
|
|
Volume Confirmed Trend Dashboard For ThinkOrSwim | Custom | 1 | |
| S | Zanger Volume Ratio for ThinkorSwim | Custom | 6 | |
|
|
Uptrick: Volume Weighted Bands for Thinkorswim | Custom | 5 |
Similar threads
-
 JAT Buy/Sell Volume Pressure Indicator For ThinkOrSwim
- Started by justAnotherTrader
- Replies: 26
-
-

-
-

Not the exact question you're looking for?
Start a new thread and receive assistance from our community.
87k+
Posts
1826
Online
Similar threads
-
JAT Buy/Sell Volume Pressure Indicator For ThinkOrSwim
- Started by justAnotherTrader
- Replies: 26
-
-
-
-
Similar threads
-
JAT Buy/Sell Volume Pressure Indicator For ThinkOrSwim
- Started by justAnotherTrader
- Replies: 26
-
-
-
-
The Market Trading Game Changer
Join 2,500+ subscribers inside the useThinkScript VIP Membership Club
- Exclusive indicators
- Proven strategies & setups
- Private Discord community
- ‘Buy The Dip’ signal alerts
- Exclusive members-only content
- Add-ons and resources
- 1 full year of unlimited support
Frequently Asked Questions
What is useThinkScript?
useThinkScript is the #1 community of stock market investors using indicators and other tools to power their trading strategies. Traders of all skill levels use our forums to learn about scripting and indicators, help each other, and discover new ways to gain an edge in the markets.
How do I get started?
We get it. Our forum can be intimidating, if not overwhelming. With thousands of topics, tens of thousands of posts, our community has created an incredibly deep knowledge base for stock traders. No one can ever exhaust every resource provided on our site.
If you are new, or just looking for guidance, here are some helpful links to get you started.
- The most viewed thread:
https://usethinkscript.com/threads/repainting-trend-reversal-for-thinkorswim.183/ - Our most popular indicator:
https://usethinkscript.com/threads/buy-the-dip-indicator-for-thinkorswim.3553/ - Answers to frequently asked questions:
https://usethinkscript.com/threads/answers-to-commonly-asked-questions.6006/
What are the benefits of VIP Membership?
VIP members get exclusive access to these proven and tested premium indicators: Buy the Dip, Advanced Market Moves 2.0, Take Profit, and Volatility Trading Range. In addition, VIP members get access to over 50 VIP-only custom indicators, add-ons, and strategies, private VIP-only forums, private Discord channel to discuss trades and strategies in real-time, customer support, trade alerts, and much more. Learn all about VIP membership here.
How can I access the premium indicators?
To access the premium indicators, which are plug and play ready, sign up for VIP membership here.