AGAIG As Good As It Gets
RINSE & REPEAT TRADING
RINSE & REPEAT TRADING
I am a day trader who rarely trades 0DTE (Zero Days Until Expiration) securities (Stocks, ETFs, etc.). As a Day Trader, it is my goal to start the day in cash and end the day back in cash. As such my trading style is called “Rinse and Repeat” where the goal is to trade intraday (In/OUT) on securities whose expiration is four to eight days from expiration.
Monday thru Thursday Noon, I basically trade Friday’s expiration. Thursday afternoon and Friday, I will usually trade the following Friday with 7-8 DTE.
Some traders may not be able to do intraday trading due to FINRA regulations requiring $25K+ account balances. A ray of hope for those of you with smaller accounts is that FINRA is proposing a decrease in the amount of cash required, which will probably take place in early 2026? I recommend this style of trading (Rinse and Repeat) within your financial capabilities. Of course, there is always a cash account available, which has different trading parameters.

With the Rinse and Repeat method, I currently trade 10-12 contracts at a time using disciplined entry and exit points with my AGAIG charting. During the past 12-14 years I have traded every time frame available and am currently using a ten-minute time frame.
History shows that on average stocks move 6-10 candles in each time frame before changing direction, and ten minutes is a less stressful time frame for me at my advanced age.
So, what is my recipe for “Rinse and Repeat” trading?
First of all, I want to trade stocks that move more than five points per day. My interest lies in determining how many points it moves on an intra-day basis. For that purpose, I look at changes-in-direction that take place intra-day on an average basis during the past several days. I have also learned that “greed” is where most traders end up losing money. It has been my experience that taking smaller predictable profits multiple times can produce higher profits in the long run when added together.
If a stock moves intra-day 2-3 points on a regular basis, I will place my trade trying to get as close to the
Mid-range as possible versus the Natural trading amount. My experience has shown that adding 0.1 cent to 0.5 cents to the Mid price frequently gets filled. My trades are placed ATM (At-the-Money) or first bar ITM (In-the-Money). Once a trade is in place I will enter a GTC (Good-until-cancelled) price .55 cents above price paid which means $550 profit desired on a 10-contract trade. If the intra-day movement is usually more than two points intra-day, I may raise my profit expectations (however, I do like the sound of a trade automatically closing).
Two stocks I like to trade are MSTR and COIN as these have more volatility and frequently move several points. For these, I will frequently enter the trade and watch for the next turning point before exiting, or I might place a GTC for $1-3 dollars more than paid. The 12-day ATR is 11.8 points/day for MSTR and 13.5 points/day for COIN. These can easily pay $4 or more than your entry price, but be careful as “hope” is not a good trading strategy.
The other three I’m showing on my other chart is SHOP, MSFT and PLTR, but there are many other stocks one can use for this purpose.
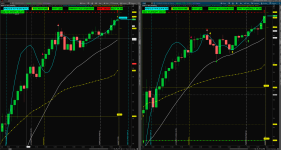
On these charts my labels are: ATR (Average True Range), Price Above, Within, or Below the Opening Range Breakout (ORB), My Traffic Light Indicator, STRATEGY: Buy Calls (Bullish) = Green, or Buy PUTS (Bearish) = Red.
On the Chart itself I am using the Murrey Math Pivot Points, VWAP, My AGAIG Price Pointer, ORB Yellow Dashed and Solid Lines, MY AGAIG 3Trend Indicator Arrows, A PolyQuadraticMovingAverage Solid Blue Line, My UpperSquaredHistogram (Red or Green suggesting change-in-Direction), a White 20 EMA line, and My AsGoodAsItGets Long/Short Bubbles.
My Long/Short Bubble appear when stock has reached 1.75 ATR and the Red/Green Histogram at 2.0 ATR. When both of these appear it means there are two indicators in agreement. The goal is to have two (or more) indicators in agreement before placing trades. My charts include the least amount of information I need to make a trade. I like Visual Simple Charts (If you can’t see it why trade it)?
Hopefully this diatribe will be of use to some of you? Comments are always appreciated.
The AGAIG Rinse and Repeat 2Chart Link: http://tos.mx/!hVLMz6Sl
The AGAIG Rinse and Repeat 3Chart Link: http://tos.mx/!nYPMSJJi
The 2Chart Look:
The 3Chart Look:
Last edited by a moderator:

 I will be spending this weekend looking back at the past 90 days of MSTR and COIN, so as to familiarize myself more of the price action and curb my nervousness given this new size