ATR + Volume Spikes For ThinkOrSwim

I loaded this script into my scanner for both a buy and sell on the S&P 100 yesterday and I didn't get any signals. Did you try this on Friday by chance? Many thanks.
I hit on 2 with the 15 minute scan lol... FWRG and SRE
1761439255155.png

Zooming out to a daily scan I hit on 50 - hour scan hit on 6 and 30 minute hit on 4
 
I loaded this script into my scanner for both a buy and sell on the S&P 100 yesterday and I didn't get any signals. Did you try this on Friday by chance? Many thanks.
This is an example of a stock in 3 of th e4 returned hits
1761439678660.png
 
Can an alert be set up to notify the user when price action crosses the VWMA line or the candles turn from red to green or green to red?
 
not sure this is what i just got right before close https://tos.mx/!7UVXWGqp View attachment 26127
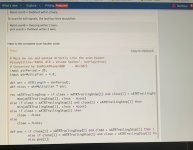
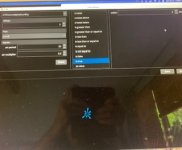
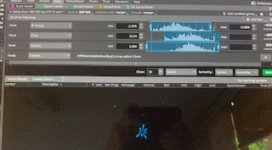
I still don't see anything show up. have attached the script I used for the scan, and two of the scan boxes. Any ideas are appreciated.
not sure this is what i just got right before close https://tos.mx/!7UVXWGqp View attachment 26127
I still get nothing. Here is the script I used . I modified the last two lines for a buy or sell. The other two photos show screens for setting up the scan. I made the % up and down much larger than normal to see if that made a difference. Many thanks for your suggestions.
 

Attachments

  • IMG_8882.jpg
    IMG_8882.jpg
    17.9 KB · Views: 30
  • IMG_8884.jpg
    IMG_8884.jpg
    69.5 KB · Views: 23
  • IMG_8883.jpg
    IMG_8883.jpg
    19.9 KB · Views: 24
@antwerks Can an alert be set up to notify the user when price action crosses the VWMA line or the candles turn from red to green or green to red?

Code:
# --- VWMA Cross Alerts ---
def vwma = VWMA(Source, movAvgLength); # Uses your existing VWMA definition

# Detect crossovers
def crossAboveVWMA = close crosses above vwma;
def crossBelowVWMA = close crosses below vwma;

# --- Plot Visual Markers ---
plot upArrow = if crossAboveVWMA then low - (TickSize() * 10) else Double.NaN;
plot downArrow = if crossBelowVWMA then high + (TickSize() * 10) else Double.NaN;

upArrow.SetPaintingStrategy(PaintingStrategy.ARROW_UP);
upArrow.SetDefaultColor(Color.CYAN);
upArrow.SetLineWeight(2);

downArrow.SetPaintingStrategy(PaintingStrategy.ARROW_DOWN);
downArrow.SetDefaultColor(Color.MAGENTA);
downArrow.SetLineWeight(2);

# --- Alerts ---
Alert(crossAboveVWMA, "Price crossed ABOVE VWMA", Alert.BAR, Sound.Ring);
Alert(crossBelowVWMA, "Price crossed BELOW VWMA", Alert.BAR, Sound.Bell);
 
Last edited by a moderator:
I still don't see anything show up. have attached the script I used for the scan, and two of the scan boxes. Any ideas are appreciated.

I still get nothing. Here is the script I used . I modified the last two lines for a buy or sell. The other two photos show screens for setting up the scan. I made the % up and down much larger than normal to see if that made a difference. Many thanks for your suggestions.
I am afraid that I am old and can not see the images clearly. here is the code I am using. Not sure if the little changes you have made make that big of a difference. It is a tight code in terms of very specific stocks.
Code:
# SCANNER SCRIPT ONLY
#study(title="RAHUL ATR + Volume Spikes", overlay=true)
# Converted by Sam4Cok@Samer800    - 04/2025
input atrPeriod = 20;
input atrMultiplier = 4.0;

def atr = ATR(Length = atrPeriod);
def nLoss = atrMultiplier * atr;

rec xATRTrailingStop = if close > xATRTrailingStop[1] and close[1] > xATRTrailingStop[1] then
    Max(xATRTrailingStop[1], close - nLoss)
else if close < xATRTrailingStop[1] and close[1] < xATRTrailingStop[1] then
    Min(xATRTrailingStop[1], close + nLoss)
else if close > xATRTrailingStop[1] then
    close - nLoss
else
    close + nLoss;

def pos = if close[1] < xATRTrailingStop[1] and close > xATRTrailingStop[1] then 1
          else if close[1] > xATRTrailingStop[1] and close < xATRTrailingStop[1] then -1
          else pos[1];

def theLong = pos == 1 and pos[1] != 1;
def theShort = pos == -1 and pos[1] != -1;

plot scanB = theLong within 2 bars ;
#plot scanS = theShort within 2 bars;
 
@antwerks Can an alert be set up to notify the user when price action crosses the VWMA line or the candles turn from red to green or green to red?

Code:
# --- VWMA Cross Alerts ---
def vwma = VWMA(Source, movAvgLength); # Uses your existing VWMA definition

# Detect crossovers
def crossAboveVWMA = close crosses above vwma;
def crossBelowVWMA = close crosses below vwma;

# --- Plot Visual Markers ---
plot upArrow = if crossAboveVWMA then low - (TickSize() * 10) else Double.NaN;
plot downArrow = if crossBelowVWMA then high + (TickSize() * 10) else Double.NaN;

upArrow.SetPaintingStrategy(PaintingStrategy.ARROW_UP);
upArrow.SetDefaultColor(Color.CYAN);
upArrow.SetLineWeight(2);

downArrow.SetPaintingStrategy(PaintingStrategy.ARROW_DOWN);
downArrow.SetDefaultColor(Color.MAGENTA);
downArrow.SetLineWeight(2);

# --- Alerts ---
Alert(crossAboveVWMA, "Price crossed ABOVE VWMA", Alert.BAR, Sound.Ring);
Alert(crossBelowVWMA, "Price crossed BELOW VWMA", Alert.BAR, Sound.Bell);
this is what I got 15 min scan on the short side just now
1761625132730.png
 

Join useThinkScript to post your question to a community of 21,000+ developers and traders.

Similar threads

Not the exact question you're looking for?

Start a new thread and receive assistance from our community.

87k+ Posts
843 Online
Create Post

Similar threads

Similar threads

The Market Trading Game Changer

Join 2,500+ subscribers inside the useThinkScript VIP Membership Club
  • Exclusive indicators
  • Proven strategies & setups
  • Private Discord community
  • ‘Buy The Dip’ signal alerts
  • Exclusive members-only content
  • Add-ons and resources
  • 1 full year of unlimited support

Frequently Asked Questions

What is useThinkScript?

useThinkScript is the #1 community of stock market investors using indicators and other tools to power their trading strategies. Traders of all skill levels use our forums to learn about scripting and indicators, help each other, and discover new ways to gain an edge in the markets.

How do I get started?

We get it. Our forum can be intimidating, if not overwhelming. With thousands of topics, tens of thousands of posts, our community has created an incredibly deep knowledge base for stock traders. No one can ever exhaust every resource provided on our site.

If you are new, or just looking for guidance, here are some helpful links to get you started.

What are the benefits of VIP Membership?
VIP members get exclusive access to these proven and tested premium indicators: Buy the Dip, Advanced Market Moves 2.0, Take Profit, and Volatility Trading Range. In addition, VIP members get access to over 50 VIP-only custom indicators, add-ons, and strategies, private VIP-only forums, private Discord channel to discuss trades and strategies in real-time, customer support, trade alerts, and much more. Learn all about VIP membership here.
How can I access the premium indicators?
To access the premium indicators, which are plug and play ready, sign up for VIP membership here.
Back
Top