Solved! Squished (Compressed) Plots On Charts On ThinkOrSwim

merryDay

Administrative
Staff member
Staff
VIP
Lifetime
Solved! Squished (Compressed) Plots On Charts

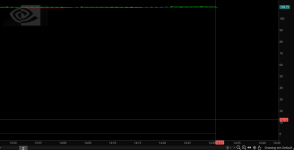
Did you add a study and now your beautiful chart has become squished and compressed, like this?
5P5Scqv.png

Try this solution:
Screenshot (190).png

1. Click on the gear icon at the top of the chart​
2. Click on Price axis​
3. Make sure all the above "Fit" choices are unchecked​
4. Save​
 

Join useThinkScript to post your question to a community of 21,000+ developers and traders.

Senior Moment again? Why is my chart compressed? Should I have changed the setting?

Thanks in advance!
Do you mean your vertical range is so compressed you can't see the candles? Typically this occurs if you have VPOC of some type of indicator that uses a very wide range on your chart.
 
Last edited by a moderator:
Chemmy TY for prompt reply I checked in Style-Settings-Price axis and I had fit studies already pressed and still compressed?
Sorry, just so I understand -- you have this already unchecked and your price axis settings are similar to this?
E4pBXI0.png


Because if you're on auto-scaling AND you're not trying to fit anything out of scale, then I don't know what else could be compressing your chart, but at that point it's certainly not this study.
 
Believe I either got this indicator from here or had chat gpt create it. Can someone fix it so that it doesn't scruch up my screen when applied? Code below. Screenshot included.

Code:
def isupfractal;
def isdownfractal;

rec hicount = if (high == high[1], hicount[1] + 1, 0);
rec hivalid = if (
(hicount[1] == 0 and hicount == 1 and high > high[2] and high > high[3]) or
(hicount[1] and hicount and hivalid[1]) or
(hicount[2] and hivalid[2] and high == high[2] and high > high[1]),
1, 0
);

rec locount = if (low == low[1], locount[1] + 1, 0);
rec lovalid = if (
(locount[1] == 0 and locount == 1 and low < low[2] and low < low[3]) or
(locount[1] and locount and lovalid[1]) or
(locount[2] and lovalid[2] and low == low[2] and low < low[1]),
1, 0
);

isupfractal = if (
((hicount and hivalid) or (high > high[1] and high > high[2])) and
high > high[-1] and high > high[-2],
high,
Double.NaN
);

isdownfractal = if (
((locount and lovalid) or (low < low[1] and low < low[2])) and
low < low[-1] and low < low[-2],
low,
Double.NaN
);

def bn = BarNumber();

# Track the two most recent up fractals
rec up1 = if !isNaN(isupfractal) then isupfractal else up1[1];
rec up1Bar = if !isNaN(isupfractal) then bn else up1Bar[1];
rec up1Broken = if !isNaN(isupfractal) then 0 else if close > up1 then 1 else up1Broken[1];

rec up2 = if !isNaN(isupfractal[1]) and up1Bar[1] != up1Bar then isupfractal[1] else up2[1];
rec up2Bar = if !isNaN(isupfractal[1]) and up1Bar[1] != up1Bar then bn - 1 else up2Bar[1];
rec up2Broken = if !isNaN(isupfractal[1]) and up1Bar[1] != up1Bar then 0 else if close > up2 then 1 else up2Broken[1];

# Track the two most recent down fractals
rec down1 = if !isNaN(isdownfractal) then isdownfractal else down1[1];
rec down1Bar = if !isNaN(isdownfractal) then bn else down1Bar[1];
rec down1Broken = if !isNaN(isdownfractal) then 0 else if close < down1 then 1 else down1Broken[1];

rec down2 = if !isNaN(isdownfractal[1]) and down1Bar[1] != down1Bar then isdownfractal[1] else down2[1];
rec down2Bar = if !isNaN(isdownfractal[1]) and down1Bar[1] != down1Bar then bn - 1 else down2Bar[1];
rec down2Broken = if !isNaN(isdownfractal[1]) and down1Bar[1] != down1Bar then 0 else if close < down2 then 1 else down2Broken[1];

# Plots
plot recentUp1 = if bn >= up1Bar and up1Broken == 0 then up1 else Double.NaN;
recentUp1.SetDefaultColor(Color.GREEN);
recentUp1.SetStyle(Curve.FIRM);
recentUp1.SetLineWeight(1);
recentUp1.HideBubble();

plot recentUp2 = if bn >= up2Bar and up2Broken == 0 then up2 else Double.NaN;
recentUp2.SetDefaultColor(Color.GREEN);
recentUp2.SetStyle(Curve.FIRM);
recentUp2.SetLineWeight(1);
recentUp2.HideBubble();

plot recentDown1 = if bn >= down1Bar and down1Broken == 0 then down1 else Double.NaN;
recentDown1.SetDefaultColor(Color.RED);
recentDown1.SetStyle(Curve.FIRM);
recentDown1.SetLineWeight(1);
recentDown1.HideBubble();

plot recentDown2 = if bn >= down2Bar and down2Broken == 0 then down2 else Double.NaN;
recentDown2.SetDefaultColor(Color.RED);
recentDown2.SetStyle(Curve.FIRM);
recentDown2.SetLineWeight(1);
recentDown2.HideBubble();

# Dots for fractal points
plot dotUp = if bn == up1Bar or bn == up2Bar then high + tickSize() else Double.NaN;
dotUp.SetPaintingStrategy(PaintingStrategy.POINTS);
dotUp.SetDefaultColor(Color.GREEN);

plot dotDown = if bn == down1Bar or bn == down2Bar then low - tickSize() else Double.NaN;
dotDown.SetPaintingStrategy(PaintingStrategy.POINTS);
dotDown.SetDefaultColor(Color.RED);
 

Attachments

  • Screenshot 2025-09-01 160749.png
    Screenshot 2025-09-01 160749.png
    85 KB · Views: 35
Last edited by a moderator:
Believe I either got this indicator from here or had chat gpt create it. Can someone fix it so that it doesn't scruch up my screen when applied? Code below. Screenshot included.

def isupfractal;
def isdownfractal;

rec hicount = if (high == high[1], hicount[1] + 1, 0);
rec hivalid = if (
(hicount[1] == 0 and hicount == 1 and high > high[2] and high > high[3]) or
(hicount[1] and hicount and hivalid[1]) or
(hicount[2] and hivalid[2] and high == high[2] and high > high[1]),
1, 0
);

rec locount = if (low == low[1], locount[1] + 1, 0);
rec lovalid = if (
(locount[1] == 0 and locount == 1 and low < low[2] and low < low[3]) or
(locount[1] and locount and lovalid[1]) or
(locount[2] and lovalid[2] and low == low[2] and low < low[1]),
1, 0
);

isupfractal = if (
((hicount and hivalid) or (high > high[1] and high > high[2])) and
high > high[-1] and high > high[-2],
high,
Double.NaN
);

isdownfractal = if (
((locount and lovalid) or (low < low[1] and low < low[2])) and
low < low[-1] and low < low[-2],
low,
Double.NaN
);

def bn = BarNumber();

# Track the two most recent up fractals
rec up1 = if !isNaN(isupfractal) then isupfractal else up1[1];
rec up1Bar = if !isNaN(isupfractal) then bn else up1Bar[1];
rec up1Broken = if !isNaN(isupfractal) then 0 else if close > up1 then 1 else up1Broken[1];

rec up2 = if !isNaN(isupfractal[1]) and up1Bar[1] != up1Bar then isupfractal[1] else up2[1];
rec up2Bar = if !isNaN(isupfractal[1]) and up1Bar[1] != up1Bar then bn - 1 else up2Bar[1];
rec up2Broken = if !isNaN(isupfractal[1]) and up1Bar[1] != up1Bar then 0 else if close > up2 then 1 else up2Broken[1];

# Track the two most recent down fractals
rec down1 = if !isNaN(isdownfractal) then isdownfractal else down1[1];
rec down1Bar = if !isNaN(isdownfractal) then bn else down1Bar[1];
rec down1Broken = if !isNaN(isdownfractal) then 0 else if close < down1 then 1 else down1Broken[1];

rec down2 = if !isNaN(isdownfractal[1]) and down1Bar[1] != down1Bar then isdownfractal[1] else down2[1];
rec down2Bar = if !isNaN(isdownfractal[1]) and down1Bar[1] != down1Bar then bn - 1 else down2Bar[1];
rec down2Broken = if !isNaN(isdownfractal[1]) and down1Bar[1] != down1Bar then 0 else if close < down2 then 1 else down2Broken[1];

# Plots
plot recentUp1 = if bn >= up1Bar and up1Broken == 0 then up1 else Double.NaN;
recentUp1.SetDefaultColor(Color.GREEN);
recentUp1.SetStyle(Curve.FIRM);
recentUp1.SetLineWeight(1);
recentUp1.HideBubble();

plot recentUp2 = if bn >= up2Bar and up2Broken == 0 then up2 else Double.NaN;
recentUp2.SetDefaultColor(Color.GREEN);
recentUp2.SetStyle(Curve.FIRM);
recentUp2.SetLineWeight(1);
recentUp2.HideBubble();

plot recentDown1 = if bn >= down1Bar and down1Broken == 0 then down1 else Double.NaN;
recentDown1.SetDefaultColor(Color.RED);
recentDown1.SetStyle(Curve.FIRM);
recentDown1.SetLineWeight(1);
recentDown1.HideBubble();

plot recentDown2 = if bn >= down2Bar and down2Broken == 0 then down2 else Double.NaN;
recentDown2.SetDefaultColor(Color.RED);
recentDown2.SetStyle(Curve.FIRM);
recentDown2.SetLineWeight(1);
recentDown2.HideBubble();

# Dots for fractal points
plot dotUp = if bn == up1Bar or bn == up2Bar then high + tickSize() else Double.NaN;
dotUp.SetPaintingStrategy(PaintingStrategy.POINTS);
dotUp.SetDefaultColor(Color.GREEN);

plot dotDown = if bn == down1Bar or bn == down2Bar then low - tickSize() else Double.NaN;
dotDown.SetPaintingStrategy(PaintingStrategy.POINTS);
dotDown.SetDefaultColor(Color.RED);
go into price action and uncheck everything, works for me that way
 
Believe I either got this indicator from here or had chat gpt create it. Can someone fix it so that it doesn't scruch up my screen when applied? Code below. Screenshot included.

Code:
def isupfractal;
def isdownfractal;

rec hicount = if (high == high[1], hicount[1] + 1, 0);
rec hivalid = if (
(hicount[1] == 0 and hicount == 1 and high > high[2] and high > high[3]) or
(hicount[1] and hicount and hivalid[1]) or
(hicount[2] and hivalid[2] and high == high[2] and high > high[1]),
1, 0
);

rec locount = if (low == low[1], locount[1] + 1, 0);
rec lovalid = if (
(locount[1] == 0 and locount == 1 and low < low[2] and low < low[3]) or
(locount[1] and locount and lovalid[1]) or
(locount[2] and lovalid[2] and low == low[2] and low < low[1]),
1, 0
);

isupfractal = if (
((hicount and hivalid) or (high > high[1] and high > high[2])) and
high > high[-1] and high > high[-2],
high,
Double.NaN
);

isdownfractal = if (
((locount and lovalid) or (low < low[1] and low < low[2])) and
low < low[-1] and low < low[-2],
low,
Double.NaN
);

def bn = BarNumber();

# Track the two most recent up fractals
rec up1 = if !isNaN(isupfractal) then isupfractal else up1[1];
rec up1Bar = if !isNaN(isupfractal) then bn else up1Bar[1];
rec up1Broken = if !isNaN(isupfractal) then 0 else if close > up1 then 1 else up1Broken[1];

rec up2 = if !isNaN(isupfractal[1]) and up1Bar[1] != up1Bar then isupfractal[1] else up2[1];
rec up2Bar = if !isNaN(isupfractal[1]) and up1Bar[1] != up1Bar then bn - 1 else up2Bar[1];
rec up2Broken = if !isNaN(isupfractal[1]) and up1Bar[1] != up1Bar then 0 else if close > up2 then 1 else up2Broken[1];

# Track the two most recent down fractals
rec down1 = if !isNaN(isdownfractal) then isdownfractal else down1[1];
rec down1Bar = if !isNaN(isdownfractal) then bn else down1Bar[1];
rec down1Broken = if !isNaN(isdownfractal) then 0 else if close < down1 then 1 else down1Broken[1];

rec down2 = if !isNaN(isdownfractal[1]) and down1Bar[1] != down1Bar then isdownfractal[1] else down2[1];
rec down2Bar = if !isNaN(isdownfractal[1]) and down1Bar[1] != down1Bar then bn - 1 else down2Bar[1];
rec down2Broken = if !isNaN(isdownfractal[1]) and down1Bar[1] != down1Bar then 0 else if close < down2 then 1 else down2Broken[1];

# Plots
plot recentUp1 = if bn >= up1Bar and up1Broken == 0 then up1 else Double.NaN;
recentUp1.SetDefaultColor(Color.GREEN);
recentUp1.SetStyle(Curve.FIRM);
recentUp1.SetLineWeight(1);
recentUp1.HideBubble();

plot recentUp2 = if bn >= up2Bar and up2Broken == 0 then up2 else Double.NaN;
recentUp2.SetDefaultColor(Color.GREEN);
recentUp2.SetStyle(Curve.FIRM);
recentUp2.SetLineWeight(1);
recentUp2.HideBubble();

plot recentDown1 = if bn >= down1Bar and down1Broken == 0 then down1 else Double.NaN;
recentDown1.SetDefaultColor(Color.RED);
recentDown1.SetStyle(Curve.FIRM);
recentDown1.SetLineWeight(1);
recentDown1.HideBubble();

plot recentDown2 = if bn >= down2Bar and down2Broken == 0 then down2 else Double.NaN;
recentDown2.SetDefaultColor(Color.RED);
recentDown2.SetStyle(Curve.FIRM);
recentDown2.SetLineWeight(1);
recentDown2.HideBubble();

# Dots for fractal points
plot dotUp = if bn == up1Bar or bn == up2Bar then high + tickSize() else Double.NaN;
dotUp.SetPaintingStrategy(PaintingStrategy.POINTS);
dotUp.SetDefaultColor(Color.GREEN);

plot dotDown = if bn == down1Bar or bn == down2Bar then low - tickSize() else Double.NaN;
dotDown.SetPaintingStrategy(PaintingStrategy.POINTS);
dotDown.SetDefaultColor(Color.RED);

the chart is squished because you have a plot that seems to be 0 all the time.

step 1 , never use chatgpt again. its garbage. take the time to learn thinkscript.
step 2 , add a bubble to display values. then you will verify which variable is wrong. recentDown2

Code:
addchartbubble(1,low,
recentUp1 + "\n" +
recentUp2 + "\n" +
recentDown1 + "\n" +
recentDown2 + "\n" +
dotUp + "\n" +
dotDown + "\n"
, color.yellow, no);

step 3 , look at the code that creates data for recentDown2 and follow it backwards , and add more variables to the bubble ( and disable some) , and figure out why it is always 0.
 
Last edited:

Not the exact question you're looking for?

Start a new thread and receive assistance from our community.

87k+ Posts
466 Online
Create Post

The Market Trading Game Changer

Join 2,500+ subscribers inside the useThinkScript VIP Membership Club
  • Exclusive indicators
  • Proven strategies & setups
  • Private Discord community
  • ‘Buy The Dip’ signal alerts
  • Exclusive members-only content
  • Add-ons and resources
  • 1 full year of unlimited support

Frequently Asked Questions

What is useThinkScript?

useThinkScript is the #1 community of stock market investors using indicators and other tools to power their trading strategies. Traders of all skill levels use our forums to learn about scripting and indicators, help each other, and discover new ways to gain an edge in the markets.

How do I get started?

We get it. Our forum can be intimidating, if not overwhelming. With thousands of topics, tens of thousands of posts, our community has created an incredibly deep knowledge base for stock traders. No one can ever exhaust every resource provided on our site.

If you are new, or just looking for guidance, here are some helpful links to get you started.

What are the benefits of VIP Membership?
VIP members get exclusive access to these proven and tested premium indicators: Buy the Dip, Advanced Market Moves 2.0, Take Profit, and Volatility Trading Range. In addition, VIP members get access to over 50 VIP-only custom indicators, add-ons, and strategies, private VIP-only forums, private Discord channel to discuss trades and strategies in real-time, customer support, trade alerts, and much more. Learn all about VIP membership here.
How can I access the premium indicators?
To access the premium indicators, which are plug and play ready, sign up for VIP membership here.
Back
Top