TTM Squeeze Format, Scan, Watchlist, Label For ThinkOrSwim

BenTen

Administrative
Staff member
Staff
VIP
Lifetime
For those of you who enjoy using the TTM Squeeze & Momentum indicator, this should be a handy addition to your ThinkorSwim chart setup. The script will add the status of the TTM Squeeze for stocks on your watchlist via a new column. You can select whichever timeframe you would like to scan for TTM squeeze.

Stocks usually break out of consolidations and by having the TTM Squeeze on your watchlist it helps to alert when they do.

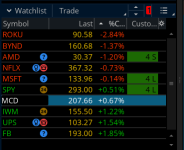
Here is what each signal and labels represent:
  • Bright Red: The stock is in Buy zone
  • Dark Red: Market compression is currently in this time period. The number reveals the amount of dots on your TTM Squeeze indicator.
  • Dark Green: The squeeze has fired. The number notes how many dots (up to 5) and whether the squeeze signaled Long or Short.
  • Black: No squeeze on this time frame

YexBBcI.png


thinkScript Code

Code:
# Squeeze watchlist column
#   Red Background   - Squeeze is building in the time period - number indicates how many dots
#      w/ white "B"  - Squeeze is building, stock is within "buy zone"
#   Green Background - Squeeze has fired - number indicates how many dots (up to 5 dots)
#                      and whether Squeeze fired L(ong) or S(hort)
#   Black Background - No Squeeze in play

# Original code by Eric Purdy of Simpler Trading 2017
# Modified code by Rich Stratmann to put in background colors and shorten column values
# Updates by dmccuskey
#   - change background colors to aid content scanning
#   - add "B" to time frames which are in the Buy Zone - between 8 & 21 EMA
#   - change "0" to " " <space> so that the content doesn't show when row is highlighted

#ToS Share Code: https://tos.mx/IPrEhH

def sqz = !TTM_Squeeze().SqueezeAlert;
def direction = TTM_Squeeze()>TTM_Squeeze()[1];
def count = if sqz and !sqz[1] then 1 else count[1]+1;
def isFired = if !sqz and sqz[1] then 1 else 0;
def firedCount = if isFired then 1 else firedCount[1]+1;
def firedDirection = if isFired then direction else firedDirection[1];

def sumIsFired = sum(isFired,5);
def isFiredDir = sumIsFired && firedDirection;

# look for close buy zone
def ema8 = reference movAvgExponential(length=8);
def ema21 = reference movAvgExponential(length=21);
def currPrice = close();
def highVal = Max(ema8, ema21);
def lowVal = Min(ema8, ema21);
def inBuyZone = currPrice >= lowVal && currPrice <= highVal;

def sqzBuy = sqz && inBuyZone;
def sqzNoBuy = sqz && !inBuyZone;

addLabel(yes, Concat(if sqzBuy then "B " else "", if sqz then "" + count else if sumIsFired then “” + firedCount + if firedDirection then ” L” else ” S” else “ ”), if sqzBuy then color.white else color.black);

AssignBackgroundColor(if sqzNoBuy then  CreateColor(170, 6, 0) else if sqzBuy then color.red else if sumIsFired then CreateColor(28, 105, 3) else color.black);

Shareable Link

https://tos.mx/uXplYi

Credits:
 

Attachments

  • YexBBcI.png
    YexBBcI.png
    38.1 KB · Views: 273
Last edited:

Join useThinkScript to post your question to a community of 21,000+ developers and traders.

Code:
def squeeze = if(reference BollingerBands()."upperband" - KeltnerChannels()."Upper_Band")<0 then 1 else 0;

def insqueeze = if squeeze then insqueeze[1] + 1 else 0;

def fired = if !squeeze then fired[1]+1 else 0;

def direction = if (fired == 1 , if( TTM_Squeeze() > TTM_Squeeze()[1] , 1 , 0 ),  direction[1]);

plot result = if insqueeze > 0 then insqueeze else if fired >0 and fired <8 then fired else 0;

AddLabel(yes, Concat(if insqueeze>0 then "Squeeze: " else if fired >0 and fired <8 then Concat("FIRED: ", if direction then "? " else "? ") else "", result), if insqueeze>0 then color.white else color.black);

AssignBackgroundColor( if insqueeze>0 then color.red else if fired>0 and fired <8 then color.green else color.black);

This is the code i use for my watchlist column, very similar to yours in fact it may be the exact same, but Im not 100% sure since i know nothing about coding. But visually its slightly different and you can customize to whatever timeframe you want, it just wont say if it fired long or short.
 
Does anyone know how to program a scan using the TTM Squeeze indicator that will indicate that a squeeze has fired LONG within 15 bars with NO loss of momentum?

Thanks,
Mike D.
 
About two years ago I saw where a thinkscripter had developed labels to set general expectations for squeeze history, but I did not save the script unfortunately. While this label is not a trade trigger type of indicator, it can be used to quickly set expectations for squeeze occurrence frequency and duration. I would like to see if I can get some help building it as follows and others might also like to learn from the process as we go. Here are the steps I would propose:
  1. Start with a label (or what will be the initial showing in the ultimate label) that shows the number of bars in the chart being viewed (i.e. there are X number of bars on this chart).
  2. The next part of the label will say there are X total bars in the TTM squeeze on this chart.
  3. The other parts of the label are then just mathematical derivative parts of the label from these two measures which most interesting are:
    1. What percent of bars are in a squeeze (number of squeezes / total bars as a % ) - this shows how frequently this occurs of all bars
    2. How frequently does a squeeze series initiate - so number of unbroken series (prior bar no squeeze but current bar is squeeze) shows the number of not just the frequency of all bar in squeeze but how frequently a squeeze sequence initiates
    3. Average squeeze duration - shows of all the unbroken series how many bars would be in a squeeze - this is perhaps the most useful as you can characterize and instrument (or at least its period in the chart) to set expectations on how long that might last
    4. Other things are also possible like shortest, longest, longest between squeeze series ...
Once the framework design is made, it is conceivable that any indicator occurrence could be substituted for the squeeze.
 
Saw some discussions on squeeze watchlists on some other threads, thought I'd ahre what I have.
Here's a version from my files

Code:
# TTM Squeeze Watchlist
# TSL
# 11.13.2019

input price = close;
input length = 20;
input nK = 1.5;
input nBB = 2.0;
input alertLine = 1.0;

def squeezeDots = TTM_Squeeze(price, length, nK, nBB, alertLine).SqueezeAlert;
def alertCount = if squeezeDots[1] == 0 and squeezeDots == 1 then 1 
                 else if squeezeDots == 1 then alertCount[1] + 1 
                 else 0;
plot data = alertCount;
data.SetDefaultColor(Color.BLACK);

def squeezeHistogram = TTM_Squeeze(price, length, nK, nBB, alertLine).Histogram;
AssignBackgroundColor(if squeezeHistogram >= 0 
                      then if squeezeHistogram > squeezeHistogram[1] then Color.CYAN else Color.BLUE
                      else if squeezeHistogram < squeezeHistogram[1] then Color.RED else Color.YELLOW);
 
Hello Ben, In the original TTM squeeze, it's possible to change the length from the default of 20 to your liking. Can adjustable length be added to this study?

I was looking for that and cannot find it (I am referring to the code in post #1 above) not to tomsk in post #3. I did however find another TTM squeeze alert that I was able to find and change the length, so no need to alter anything on my account. Again, thanks to all who contribute to the best site I know.
 
Here's a squeeze count for Watchlist from Mobius, you can adapt this for us on a study if you wish

Code:
# Squeeze Count Watchlist
# Mobius
# 11.09.2015

def Squeeze = BollingerBands().UpperBand < KeltnerChannels().Upper_Band;
def count = if !Squeeze
            then 0
            else if Squeeze
                 then count[1] + 1
                 else count[1];
AddLabel(1, if Squeeze then count else 0,
            if Squeeze
            then Color.Black
            else Color.WHITE);
AssignBackgroundColor(if Squeeze then color.green else color.white);
 
Wanting to have a label (labels) on the bottom secion of my chart that shows me the squeeze information along with what time frame. Can someone help with that. I saw this on someones chart and liked it but can't find how they did it. I use 5 different charts but with just the lower indicators desplayed to the left side of my area and each are with a different time frame. So I can just see the TTm Squeeze for each in each of those timeframes. I have these stacked Then I have an upper chart to the right of that that just shows me the current time frame with my upper part displayed. Trying to figure out how to upload an image. Hope I am doing this right by asking. Thanks for any help.
 
Hi @brendab180 Attach a chart for free by going to Imgur.com.
Here's a start.
Code:
# Squeeze Count Watchlist
# Mobius
# 11.09.2015
 
def Squeeze = BollingerBands().UpperBand < KeltnerChannels().Upper_Band;

def count = if !Squeeze
            then 0
            else if Squeeze
                 then count[1] + 1
                 else count[1];

AddLabel(1, if Squeeze then count else 0,
            if Squeeze 
            then Color.Black
            else Color.WHITE);
AssignBackgroundColor(if Squeeze then color.green else color.white);
 
Here's another from the Think Script Lounge via the Universe of Thinkscript in the Tutorial Section.

11:08 Mobius: Here is the TTM Squeeze study that I wrote
Code:
# Momentum Squeeze
# Mobius
# Added Squeeze Label with directional color
# Label is green when momentum is ascending, red when descending

declare lower;

input length = 20; #hint length: Length for average calculation
input SDmult = 2.0;
input ATRmult = 1.5;

   def c = close;
   def h = high;
   def l = low;
   def K = (Highest(h, length) + Lowest(l, length)) /
               2 + ExpAverage(c, length);
  plot Momo = if isNaN(close)
              then double.nan
              else Inertia(c - K / 2, length);
       Momo.setPaintingStrategy(PaintingStrategy.HISTOGRAM);
       Momo.setLineWeight(3);
       Momo.assignValueColor(if Momo > Momo[1] and Momo > 0
                             then Color.Cyan
                             else if Momo > 0 and Momo < Momo[1]
                             then Color.Blue
                             else if Momo < 0 and Momo < Momo[1]
                             then Color.Red
                             else Color.Yellow);

def SD = StDev(c, length);
def Avg = Average(c, length);
def ATR = Average(TrueRange(h, c, l), length);
def SDup = Avg + (SdMult * Sd);
def ATRup = Avg + (AtrMult * ATR);

plot Squeeze = if isNaN(c)
               then double.nan
               else if SDup < ATRup
               then 0
               else Double.NaN;

     Squeeze.SetPaintingStrategy(PaintingStrategy.Points);

     Squeeze.SetLineWeight(3);

     Squeeze.SetDefaultColor(Color.Red);

plot zero = if IsNaN(c) or !IsNaN(Squeeze) then Double.NaN else 0;
     zero.SetPaintingStrategy(PaintingStrategy.Points);
     zero.SetLineWeight(3);
     zero.SetDefaultColor(Color.Green);

AddLabel(!isNaN(Squeeze), "Squeeze", if isAscending(Momo)
                                     then Color.Green
                                     else Color.Red);

 
# End Code - Momentum Squeeze
 
here is a pic of what I am looking for. I have the chart layout just as it looks but wanting the labels for the time frames where the ttm squeeze bottom charts are. And then like a count. If say time frame 30 min has two red dots at the moment would be in squeeze 2 and then when first green dot would be a time cycle so say time cycle 1 or fired. Something like that. I will try the part you posted to see what it looks like. Thanks for the feed back and helping with sharing a pic. :)
 
@BenTen - Thanks for this. I'm new to Think Script. I've uploaded the indicator to my watch list, no problem but I don't see how to determine/switch which time frame I want the indicator reflect for the squeeze (ex- 5 min or 30 min or.....).
Thanks in advance.
 
Code:
# This 'Squeeze Watchlist Column' shows when a stock is currently in a squeeze or the number of bars ago that the squeeze ended. The number of bars in a squeeze is shown on a red background using '=?' or '>=13'. When larger than 12 bars, the value is shown as >=13. The bars since the squeeze ended is shown in green as '-? ago' where ? is a maximum of 6.
#The suggested title is 'SQZ'.
# This issued version is based on a 1 minute aggregation that can be changed by editing the code and changing the aggregation at the top of the edit screen. It is meaningful to have the column aggregation match the chart aggregation to avoid confusion.
#Revised 9/29/12

def keltnerChannelATRs = 1.5 ;
def bollingerBandStdDev = 2 ;

# Average True Range
def ATR = AvgTrueRange(high, close, low, 20);

# Standard Deviation
def SDev = stdev(close, 20);

# -- Calculate Bollinger Band Squeeze Indicator --
# for alert
def Denom = (keltnerChannelATRs * ATR);
def BBS_Ind = if (Denom <> 0, ((bollingerBandStdDev * SDev) / Denom), 0);#A squeeze is on if BBS_Ind < 1.0

#Count number of squeeze bars
def Sq_Count_0 = If BBS_Ind < 1.0 then 1 else 0;
def Sq_Count_1 = If BBS_Ind[1] < 1.0 && Sq_Count_0 == 1 then 1 else 0;
def Sq_Count_2 = If BBS_Ind[2] < 1.0  && Sq_Count_1 == 1 then 1 else  0;
def Sq_Count_3 = If BBS_Ind[3] < 1.0 && Sq_Count_2 == 1 then 1 else 0;
def Sq_Count_4 = If BBS_Ind[4] < 1.0 && Sq_Count_3 == 1 then 1 else 0;
def Sq_Count_5 = If BBS_Ind[5] < 1.0 && Sq_Count_4 == 1 then 1 else 0;
def Sq_Count_6 = If BBS_Ind[6] < 1.0 && Sq_Count_5 == 1 then 1 else 0;
def Sq_Count_7 = If BBS_Ind[7] < 1.0 && Sq_Count_6 == 1 then 1 else 0;
def Sq_Count_8 = If BBS_Ind[8] < 1.0 && Sq_Count_7 == 1 then 1 else 0;
def Sq_Count_9 = If BBS_Ind[9] < 1.0 && Sq_Count_8 == 1 then 1 else 0;
def Sq_Count_10 = If BBS_Ind[10] < 1.0 && Sq_Count_9 == 1 then 1 else 0;
def Sq_Count_11 = If BBS_Ind[11] < 1.0 && Sq_Count_10 == 1 then 1 else 0;
def Sq_Count_12 = If BBS_Ind[12] < 1.0 && Sq_Count_11 == 1 then 1 else 0;
def Sq_Count = if BBS_Ind < 1.0 && Sq_Count_0 == 1 then (Sq_Count_0 + Sq_Count_1 + Sq_Count_2 + Sq_Count_3 + Sq_Count_4 + Sq_Count_5 + Sq_Count_6 + Sq_Count_7 + Sq_Count_8 + Sq_Count_9 + Sq_Count_10 + Sq_Count_11 + Sq_Count_12) else 0;

Def Post_Count = if BBS_Ind[1] < 1.0  && BBS_Ind[0] > 1.0 then 1
else if BBS_Ind[2] < 1.0  && BBS_Ind[1] > 1.0 then 2
else if BBS_Ind[3] < 1.0  && BBS_Ind[2] > 1.0 then 3
else if BBS_Ind[4] < 1.0  && BBS_Ind[3] > 1.0 then 4
else if BBS_Ind[5] < 1.0 && BBS_Ind[4] > 1.0  then 5
else if BBS_Ind[6] < 1.0 && BBS_Ind[5] > 1.0 then 6
else Double.nan;

#plot data = post_Count;#Used for testing

AddLabel(yes,if Sq_Count == 13 then Concat(">=" , Sq_Count) else if between(Sq_Count,1,12) then concat("=", Sq_Count) else if between(Post_Count,1,6) then concat("-",Concat(Post_Count," ago")) else "0");

Assignbackgroundcolor (if (Sq_Count >= 13) then color.Dark_red
else if between(Sq_Count,1,12)  then color.red
else if between(Post_Count,1,6) then color.Dark_green
else color.current);


######### EOC ###########
 
Hey everyone, I have this code I'm using in my watchlist but I wanted to adjust it so that instead of black backgrounds and color words, I wanted to flip flop it so that the background is colored so that way when the squeeze lines up on multiple time frames, I can see it more clearly. Pretty new to coding, and more specifically think script so just reaching out for some help.

Thanks!

Code:
# Simpler Trading Squeeze watchlist column - Eric Purdy 2017

# Shared Link -    https://tos.mx/5cpgKa
#Start
def sqz = !TTM_Squeeze().SqueezeAlert;
def direction = TTM_Squeeze()>TTM_Squeeze()[1];
def count = if sqz and !sqz[1] then 1 else count[1]+1;
def fired = if !sqz and sqz[1] then 1 else 0;
def firedCount = if fired then 1 else firedCount[1]+1;
def firedDirection = if fired then direction else firedDirection[1];
addLabel(yes, if sqz then “Squeeze:” + count else if sum(fired,5) then “Fired:” + firedCOunt + if firedDirection then ” Long” else ” Short” else “-”, if sqz then color.red else if sum(fired,5) and firedDirection then color.green else color.orange);
#Finish
 
Ben, thank you for the script and load it for my watchlist. But What's the time frame for the TTM squeeze being used for the watchlist? where can we set up timeframe?

Never mind. it can be modified when column is added.
 
Last edited by a moderator:
I use the TTM Squeeze a lot. Can someone make an custom scan to create a watchlist that tells me which stocks with TTM squeeze just turned Red to Yellow within a day and drop off from the watchlist when TTM squeeze turns from light blue to Dark Blue losing momentum.
 
Following code has 4 different scans including 2 you need. Play with all 4 and figure out what you need. Have fun!

Code:
declare lower;

input price = CLOSE;
input length = 20;
input nK = 1.5;
input nBB = 2.0;
input alertLine = 1.0;

plot scan;

def squeezeHistogram = TTM_Squeeze(price, length, nK, nBB, alertLine).Histogram;


def momentumPivotLow = (squeezeHistogram > squeezeHistogram[1] and squeezeHistogram[1] < squeezeHistogram[2]) ;

def momentumPivotHigh = (squeezeHistogram < squeezeHistogram[1] and squeezeHistogram[1] > squeezeHistogram[2]);

#plot barsSincePivot = GetMaxValueOffset(momentumPivot);

def pivotLowFollowThrough = (momentumPivotLow[1] and squeezeHistogram > squeezeHistogram[1]);

def pivotHighFollowThrough = (momentumPivotHigh[1] and squeezeHistogram < squeezeHistogram[1]);

def zeroLinePositiveFollowThrough = ( squeezeHistogram > 0 and squeezeHistogram[1] > 0 and squeezeHistogram[2] < 0 ) ;

def zeroLineNegativeFollowThrough = (squeezeHistogram < 0 and squeezeHistogram[1] < 0 and squeezeHistogram[2] > 0);

# uncomment one to scan for pivot high/low with follow through bar
#scan = pivotHighFollowThrough;
scan = pivotLowFollowThrough;

# uncomment one to scan for zero line positive/negative with follow through bar
#scan = zeroLinePositiveFollowThrough;
#scan = zeroLineNegativeFollowThrough;
 
@pk1729 I have something like this, I need a query for the scan the exactly when the Red becomes Yellow so that I can have in my watchlist and create alerts when new stocks gets added and removed.
 
Any ideas on how to tweak the scanner for the TTM Squeeze to find stocks that have already fired off rather than still being in a red dot squeeze. In laymans terms, a scanner that will tell me when the red dot squeeze changes and has its first green dot.

I am looking for a scanner that works on the 1 hr chart

any suggestions ??
 

Similar threads

Not the exact question you're looking for?

Start a new thread and receive assistance from our community.

87k+ Posts
461 Online
Create Post

Similar threads

Similar threads

The Market Trading Game Changer

Join 2,500+ subscribers inside the useThinkScript VIP Membership Club
  • Exclusive indicators
  • Proven strategies & setups
  • Private Discord community
  • ‘Buy The Dip’ signal alerts
  • Exclusive members-only content
  • Add-ons and resources
  • 1 full year of unlimited support

Frequently Asked Questions

What is useThinkScript?

useThinkScript is the #1 community of stock market investors using indicators and other tools to power their trading strategies. Traders of all skill levels use our forums to learn about scripting and indicators, help each other, and discover new ways to gain an edge in the markets.

How do I get started?

We get it. Our forum can be intimidating, if not overwhelming. With thousands of topics, tens of thousands of posts, our community has created an incredibly deep knowledge base for stock traders. No one can ever exhaust every resource provided on our site.

If you are new, or just looking for guidance, here are some helpful links to get you started.

What are the benefits of VIP Membership?
VIP members get exclusive access to these proven and tested premium indicators: Buy the Dip, Advanced Market Moves 2.0, Take Profit, and Volatility Trading Range. In addition, VIP members get access to over 50 VIP-only custom indicators, add-ons, and strategies, private VIP-only forums, private Discord channel to discuss trades and strategies in real-time, customer support, trade alerts, and much more. Learn all about VIP membership here.
How can I access the premium indicators?
To access the premium indicators, which are plug and play ready, sign up for VIP membership here.
Back
Top