input StartTime = 0400;
input extend = yes;
input endtime = 0929;
input Channel_1_Width = 1.0;
input Channel_2_Width = 2.0;
input Channel_3_Width = 3.0;
input Channel_4_Width = 4.0;
input Channel_5_Width = 5.0;
input Channel_6_Width = 6.0;

# Width Multiplier Input
input WidthMultiplier = 1.0;

# Adjusted Channel Widths
def Adjusted_Channel_1_Width = Channel_1_Width * WidthMultiplier;
def Adjusted_Channel_2_Width = Channel_2_Width * WidthMultiplier;
def Adjusted_Channel_3_Width = Channel_3_Width * WidthMultiplier;
def Adjusted_Channel_4_Width = Channel_4_Width * WidthMultiplier;
def Adjusted_Channel_5_Width = Channel_5_Width * WidthMultiplier;
def Adjusted_Channel_6_Width = Channel_6_Width * WidthMultiplier;

# Toggles to show/hide the channels
input ShowChannel_3 = yes; # Toggle for 3.0 width channel
input ShowChannel_4 = yes; # Toggle for 4.0 width channel
input ShowChannel_5 = yes; # Toggle for 5.0 width channel
input ShowChannel_6 = yes; # Toggle for 6.0 width channel

input lineweight = 1;

def sec1 = SecondsFromTime(StartTime);
def isTime1 = (sec1 >= 0 and sec1[1] < 0) or (sec1 < sec1[1] and sec1 >= 0);

script E
{
input y = close;
input n = 20;
def s = fold i = 0 to n
with j
do j + GetValue(y, i);
plot D = s;
}

# Variables
def o = open;
def h = high;
def l = low;
def c = close;
def x = BarNumber();
def nan = Double.NaN;
def xx = if IsNaN(c[-1]) and !IsNaN(c) then x else xx[1];
def firstBar = if isTime1 == 1
then x + 1
else firstBar[1];

# Options to End Plot Based Upon Condition and Extended from there
def cond_y = if SecondsFromTime(endtime) <= 0 then x else nan;
AddVerticalLine(x == HighestAll(cond_y), " ", Color.WHITE);
def y = if x == 1 or IsNaN(close)
then nan
else if Between(x, HighestAll(firstBar), HighestAll(cond_y))
then close
else y[1];

#############

def S_y = if x == HighestAll(firstBar)
then y
else if x > HighestAll(firstBar)
then S_y[1] + y
else S_y[1];
def S_x = if x == HighestAll(firstBar)
then 1
else if x > HighestAll(firstBar)
then S_x[1] + 1
else S_x[1];
def x0_ = HighestAll(xx) - firstBar;
def x1 = HighestAll(if !IsNaN(y) and IsNaN(y[-1])
then x
else nan);
def x0 = HighestAll(if GetValue(x, -x0_) == x1
then x
else nan);
def x_ = if GetValue(x, -x0_) >= x1
then x - x0
else x_[1];
def Ex = E(x_, x0_);
def Ey = E(y, x0_);
def Exy = E(x_ * y, x0_);
def Exsq = E(Sqr(x_), x0_);
def b = (x0_ * Exy - (Ex * Ey)) / (x0_ * Exsq - (Ex * Ex));
def a = (GetValue(Ey, x - x1) - GetValue(b, x - x1) * GetValue(Ex, x - x1)) / x0_;
def LR = a + (GetValue(b, x - x1) * x_);
def r = Max(h, c[1]) - Min(l, c[1]);
def Er = E(r, x0_) / x0_;
def mean = S_y / S_x;
def SD = Sqrt((1 / S_x) * (E(Sqr(y - mean), S_x)));

# EMA Definitions
def EMA20 = ExpAverage(close, 20);
def EMA200 = ExpAverage(close, 200);

# Plots
plot LRL = if extend == no and x <= HighestAll(cond_y)
then LR
else if extend == yes and x >= x0
then LR
else nan;
LRL.SetStyle(Curve.SHORT_DASH);
LRL.SetLineWeight(lineweight + 1);
LRL.AssignValueColor(Color.CYAN);
LRL.HideBubble();
LRL.HideTitle();

# Original Channel Widths using Adjusted Widths
plot upper1 = LRL + (HighestAll(SD) * Adjusted_Channel_1_Width);
upper1.SetStyle(Curve.MEDIUM_DASH);
upper1.SetLineWeight(lineweight);
upper1.SetDefaultColor(Color.RED);
upper1.HideBubble();
upper1.HideTitle();

plot lower1 = LRL - (HighestAll(SD) * Adjusted_Channel_1_Width);
lower1.SetStyle(Curve.MEDIUM_DASH);
lower1.SetLineWeight(lineweight);
lower1.SetDefaultColor(Color.RED);
lower1.HideBubble();
lower1.HideTitle();

plot upper2 = LRL + (HighestAll(SD) * Adjusted_Channel_2_Width);
upper2.SetStyle(Curve.LONG_DASH);
upper2.SetLineWeight(lineweight);
upper2.SetDefaultColor(Color.YELLOW);
upper2.HideBubble();
upper2.HideTitle();

plot lower2 = LRL - (HighestAll(SD) * Adjusted_Channel_2_Width);
lower2.SetStyle(Curve.LONG_DASH);
lower2.SetLineWeight(lineweight);
lower2.SetDefaultColor(Color.YELLOW);
lower2.HideBubble();
lower2.HideTitle();

# Channel Widths with visibility toggles and Adjusted Widths
plot upper3 = if ShowChannel_3 then LRL + (HighestAll(SD) * Adjusted_Channel_3_Width) else nan;
upper3.SetStyle(Curve.LONG_DASH);
upper3.SetLineWeight(lineweight);
upper3.SetDefaultColor(Color.GREEN);
upper3.HideBubble();
upper3.HideTitle();

plot lower3 = if ShowChannel_3 then LRL - (HighestAll(SD) * Adjusted_Channel_3_Width) else nan;
lower3.SetStyle(Curve.LONG_DASH);
lower3.SetLineWeight(lineweight);
lower3.SetDefaultColor(Color.GREEN);
lower3.HideBubble();
lower3.HideTitle();

plot upper4 = if ShowChannel_4 then LRL + (HighestAll(SD) * Adjusted_Channel_4_Width) else nan;
upper4.SetStyle(Curve.LONG_DASH);
upper4.SetLineWeight(lineweight);
upper4.SetDefaultColor(Color.MAGENTA);
upper4.HideBubble();
upper4.HideTitle();

plot lower4 = if ShowChannel_4 then LRL - (HighestAll(SD) * Adjusted_Channel_4_Width) else nan;
lower4.SetStyle(Curve.LONG_DASH);
lower4.SetLineWeight(lineweight);
lower4.SetDefaultColor(Color.MAGENTA);
lower4.HideBubble();
lower4.HideTitle();

plot upper5 = if ShowChannel_5 then LRL + (HighestAll(SD) * Adjusted_Channel_5_Width) else nan;
upper5.SetStyle(Curve.LONG_DASH);
upper5.SetLineWeight(lineweight);
upper5.SetDefaultColor(Color.ORANGE);
upper5.HideBubble();
upper5.HideTitle();

plot lower5 = if ShowChannel_5 then LRL - (HighestAll(SD) * Adjusted_Channel_5_Width) else nan;
lower5.SetStyle(Curve.LONG_DASH);
lower5.SetLineWeight(lineweight);
lower5.SetDefaultColor(Color.ORANGE);
lower5.HideBubble();
lower5.HideTitle();

plot upper6 = if ShowChannel_6 then LRL + (HighestAll(SD) * Adjusted_Channel_6_Width) else nan;
upper6.SetStyle(Curve.LONG_DASH);
upper6.SetLineWeight(lineweight);
upper6.SetDefaultColor(Color.BLUE);
upper6.HideBubble();
upper6.HideTitle();

plot lower6 = if ShowChannel_6 then LRL - (HighestAll(SD) * Adjusted_Channel_6_Width) else nan;
lower6.SetStyle(Curve.LONG_DASH);
lower6.SetLineWeight(lineweight);
lower6.SetDefaultColor(Color.BLUE);
lower6.HideBubble();
lower6.HideTitle();

# Plot EMAs
plot EMA20_plot = EMA20;
EMA20_plot.SetDefaultColor(Color.WHITE);
EMA20_plot.SetLineWeight(2);
EMA20_plot.HideBubble();
EMA20_plot.HideTitle();

plot EMA200_plot = EMA200;
EMA200_plot.SetDefaultColor(Color.GRAY);
EMA200_plot.SetLineWeight(2);
EMA200_plot.SetStyle(Curve.LONG_DASH);
EMA200_plot.HideBubble();
EMA200_plot.HideTitle();

# Signal Logic
# Safe Buy (CALL) Signal: Price crosses above lower channel, above both EMAs
def safe_buy = close > EMA20 and close > EMA200 and
(Crosses(close, lower1, CrossingDirection.ABOVE) or
Crosses(close, lower2, CrossingDirection.ABOVE) or
(ShowChannel_3 and Crosses(close, lower3, CrossingDirection.ABOVE)) or
(ShowChannel_4 and Crosses(close, lower4, CrossingDirection.ABOVE)) or
(ShowChannel_5 and Crosses(close, lower5, CrossingDirection.ABOVE)) or
(ShowChannel_6 and Crosses(close, lower6, CrossingDirection.ABOVE)));

# Safe Sell (PUT) Signal: Price crosses below upper channel, below both EMAs
def safe_sell = close < EMA20 and close < EMA200 and
(Crosses(close, upper1, CrossingDirection.BELOW) or
Crosses(close, upper2, CrossingDirection.BELOW) or
(ShowChannel_3 and Crosses(close, upper3, CrossingDirection.BELOW)) or
(ShowChannel_4 and Crosses(close, upper4, CrossingDirection.BELOW)) or
(ShowChannel_5 and Crosses(close, upper5, CrossingDirection.BELOW)) or
(ShowChannel_6 and Crosses(close, upper6, CrossingDirection.BELOW)));

# Aggressive Buy (CALL) Signal: Price crosses above lower channel, above EMA200, approaching EMA20
def aggressive_buy = close > EMA200 and
AbsValue(close - EMA20) <= HighestAll(SD) * 0.5 and
(Crosses(close, lower1, CrossingDirection.ABOVE) or
Crosses(close, lower2, CrossingDirection.ABOVE) or
(ShowChannel_3 and Crosses(close, lower3, CrossingDirection.ABOVE)) or
(ShowChannel_4 and Crosses(close, lower4, CrossingDirection.ABOVE)) or
(ShowChannel_5 and Crosses(close, lower5, CrossingDirection.ABOVE)) or
(ShowChannel_6 and Crosses(close, lower6, CrossingDirection.ABOVE)));

# Aggressive Sell (PUT) Signal: Price crosses below upper channel, below EMA200, approaching EMA20
def aggressive_sell = close < EMA200 and
AbsValue(close - EMA20) <= HighestAll(SD) * 0.5 and
(Crosses(close, upper1, CrossingDirection.BELOW) or
Crosses(close, upper2, CrossingDirection.BELOW) or
(ShowChannel_3 and Crosses(close, upper3, CrossingDirection.BELOW)) or
(ShowChannel_4 and Crosses(close, upper4, CrossingDirection.BELOW)) or
(ShowChannel_5 and Crosses(close, upper5, CrossingDirection.BELOW)) or
(ShowChannel_6 and Crosses(close, upper6, CrossingDirection.BELOW)));

# Plot Signals
plot BuySignal = if safe_buy or aggressive_buy then low else nan;
BuySignal.SetPaintingStrategy(PaintingStrategy.ARROW_UP);
BuySignal.SetDefaultColor(Color.GREEN);
BuySignal.SetLineWeight(3);
BuySignal.HideBubble();
BuySignal.HideTitle();

plot SellSignal = if safe_sell or aggressive_sell then high else nan;
SellSignal.SetPaintingStrategy(PaintingStrategy.ARROW_DOWN);
SellSignal.SetDefaultColor(Color.RED);
SellSignal.SetLineWeight(3);
SellSignal.HideBubble();
SellSignal.HideTitle();


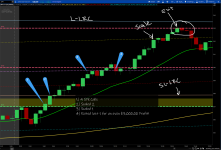
 A banger of a day. I missed posting the last couple of days. Been real busy. I did well on the Lg acct but had a Loss on Monday and Wednesday. Small 30.00 profit on Tuesday.