Center Of Gravity (COG) Indicator for ThinkorSwim

BenTen

Administrative
Staff member
Staff
VIP
Lifetime
EBPwFql.png

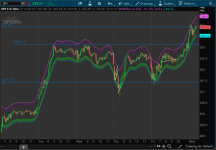
Center Of Gravity or known as COG is a momentum indicator used to identify potential reversal point when hitting the upper or lower extreme channel. When price reached one end of the channel, it's most likely going to reverse and come back.

This indicator was converted to ThinkorSwim by baffled1. It can be used on any timeframes. The Center of Gravity can be a great indicator when trading in range-bound markets. You should avoid using it when the price is trending.

qMmCYuM.png


thinkScript Code

Rich (BB code):
input price = close;
input length = -10;
def displacement = (length / 2) + 1;
def dPrice = price[displacement];
def tmp = if !IsNaN(dPrice) then Average(dPrice, AbsValue(length)) else tmp[1] + (tmp[1] - tmp
[2]);
def tmp1 = if !IsNaN(price) then tmp else Double.NaN;
plot Data = tmp1;
Data.SetDefaultColor(color.CYAN );
Data.SetStyle(Curve.SHORT_DASH);
def pct=100;
input width=65;
def d=width/pct;
def d1=0.8*d;
def d2=1.05*d;
def d3=1.15*d;
def stdDeviation = Highestall("data" = AbsValue(tmp1 - price));
plot UpperLine = tmp1 + stdDeviation*d1;
plot LowerLine = tmp1 - stdDeviation*d1;
plot UpperLine1 = tmp1 + stdDeviation*d2;
plot LowerLine1 = tmp1 - stdDeviation*d2;
plot UpperLine2 = tmp1 + stdDeviation*d3;
plot LowerLine2 = tmp1 - stdDeviation*d3;
UpperLine.SetDefaultColor(color.red);
UpperLine1.SetDefaultColor(color.red );
UpperLine2.SetDefaultColor(color.red );
LowerLine.SetDefaultColor(color.cyan );
LowerLine1.SetDefaultColor(color.cyan );
LowerLine2.SetDefaultColor(color.cyan );
AddCloud(UpperLine,UpperLine1,color.plum,color.plum);
AddCloud(LowerLine,LowerLine1,color.green,color.dark_green);

Shareable Link

https://tos.mx/wLM6Cq

Adaptive Center of Gravity

Code:
# AdaptiveCOG
# Drew Griffith

declare upper;

# Daily settings

input price = close;
input COGlength = 10;
input InnerValue = 1.0;
input OuterValue = 1.6;
input ATRLength = 14;
input showClosingPriceLine = NO;
input showPriceBar = YES;
input smooth = 1;

def displacement = (-COGlength / 2) + 1;
def dPrice = price[displacement];

def CMA = if !IsNaN(dPrice) then Average(dPrice, AbsValue(COGlength)) else
CMA[1] + (CMA[1] - CMA[2]);

def ATR = Average(TrueRange(high,  close,  low),  ATRLength);

plot UpperOuterBand = if !IsNaN(price) then CMA + (ATR * OuterValue) else
Double.NaN;
plot LowerOuterBand = if !IsNaN(price) then CMA - (ATR * OuterValue) else
Double.NaN;
plot UpperInnerBand = if !IsNaN(price) then CMA + (ATR * InnerValue) else
Double.NaN;
plot LowerInnerBand = if !IsNaN(price) then CMA - (ATR * InnerValue) else
Double.NaN;

plot Rating = if
close > UpperOuterBand then -1
else if close > UpperInnerBand then -0.5
else if close < LowerInnerBand then 0.5
else if close < LowerOuterBand then 1
else 0;

RATING.Hide();

plot CenterLine = if !IsNaN(price) then CMA else Double.NaN;
CenterLine.DefineColor("CMA", GetColor(1));
CenterLine.DefineColor("Extrapolated", GetColor(0));
CenterLine.AssignValueColor(if !IsNaN(dPrice) then CenterLine.Color("CMA")
else
CenterLine.Color("Extrapolated"));
CenterLine.SetLineWeight(2);
CenterLine.Hide();
CenterLine.SetStyle(Curve.SHORT_DASH);

UpperOuterBand.SetDefaultColor(GetColor(5));
UpperOuterBand.SetLineWeight(2);
LowerOuterBand.SetDefaultColor(GetColor(6));
LowerOuterBand.SetLineWeight(2);

UpperInnerBand.SetDefaultColor(GetColor(5));
UpperInnerBand.SetLineWeight(1);
LowerInnerBand.SetDefaultColor(GetColor(6));
LowerInnerBand.SetLineWeight(1);

# Turn AddClouds off by putting a #-sign at the first position of the lines
AddCloud(UpperOuterBand, UpperInnerBand, Color.RED);
AddCloud(LowerInnerBand, LowerOuterBand, Color.GREEN);

HidePricePlot(!showPriceBar);
 

Attachments

  • EBPwFql.png
    EBPwFql.png
    503 bytes · Views: 166
  • qMmCYuM.png
    qMmCYuM.png
    152.2 KB · Views: 188
Last edited by a moderator:

Join useThinkScript to post your question to a community of 21,000+ developers and traders.

Is it possible to make a scan that alerts when the price of the stock is in the green or below with the COG pointing up? And obviously vice-versa when COG is pointing down and price is in or above the purple portion.

 
Last edited:
@wildtrade Here you go.
Code:
# Bollinger Bands With Fibonaci levels.
# Horserider 1/24/2020
 
input price = close;
input displace = 0;
input length = 20;
input Num_Dev_Dn = -2.0;
input Num_Dev_up = 2.0;
input averageType = AverageType.Simple;
input fib1 = 0.382;
input fib2 = 0.618;
input fib3 = 0.764;


def sDev = stdev(data = price[-displace], length = length);

plot MidLine = MovingAverage(averageType, data = price[-displace], length = length);
plot LowerBand = MidLine + num_Dev_Dn * sDev;
plot UpperBand = MidLine + num_Dev_Up * sDev;

plot UpperFibLine1 = (UpperBand - MidLine) * fib1 + MidLine;
plot UpperFibLine2 = (UpperBand - MidLine) * fib2 + MidLine;
plot UpperFibLine3 = (UpperBand - MidLine) * fib3 + MidLine;

plot LowerFibLine1 = (LowerBand - MidLine) * fib1 + MidLine;
plot LowerFibLine2 = (LowerBand - MidLine) * fib2 + MidLine;
plot LowerFibLine3 = (LowerBand - MidLine) * fib3 + MidLine;


LowerBand.SetLineWeight(2);
MidLine.SetLineWeight(3);
UpperBand.SetLineWeight(2);

LowerBand.SetDefaultColor(Color.DARK_RED);
MidLine.SetDefaultColor(Color.GRAY);
UpperBand.SetDefaultColor(Color.DARK_RED);

UpperFibLine1.SetDefaultColor(Color.GRAY);
UpperFibLine2.SetDefaultColor(Color.GRAY);
UpperFibLine3.SetDefaultColor(Color.GRAY);

LowerFibLine1.SetDefaultColor(Color.GRAY);
LowerFibLine2.SetDefaultColor(Color.GRAY);
LowerFibLine3.SetDefaultColor(Color.GRAY);

UpperFibLine1.SetStyle(Curve.SHORT_DASH);
UpperFibLine2.SetStyle(Curve.SHORT_DASH);
UpperFibLine3.SetStyle(Curve.SHORT_DASH);

LowerFibLine1.SetStyle(Curve.SHORT_DASH);
LowerFibLine2.SetStyle(Curve.SHORT_DASH);
LowerFibLine3.SetStyle(Curve.SHORT_DASH);
 
I was wondering if anyone had or converted this indicator to TOS? Been looking for something similar to bollinger bands with Fibs built in. Or maybe COG indicator
TCB%2BMC%2B%25281%2529.png
I need to try out this TrueCenterBand indicator, if only someone could port it over to tos
 
@xiaxia Just guessing but I bet there is nothing special about those bands. You can also simulate them by adding 2 or 3 Bollinger bands studies or exponential deviation band studies and varying the outer bands say to maybe 1 , 2 , and 3 or whatever numbers you prefer.
 
The colored charts ( black background ) are polynomial regression channel plots ( not COG plots). Could be a quadratic (2). Could be greater than 2 - now that would be cool.

This dude wants $200 for his TOS code. :p

https://funwiththinkscript.com/indicators/polynomial-regression-channel/
But alas, we have PRC code in C# ( ninja ).

https://www.mypivots.com/board/topic/6450/1/polynomial-regression-channel-bands
The download is safe - extracted the PRC2.cs file only and it appears to work on NT4/5.

So here's the question of the day? Who feels like converting PRC2.CS to TOS?
 
TOS drawing tools has Fib fans, arcs n spirals that would probably give the same information. I use the fib fans a lot and they are great for those price levels.
 
@spm009 Must note that this indicator kind of repaint. It will fluctuate along with the price. Careful when using it.
Hey Ben, are you saying that the upper green and lower red repaint? For instance, if one min ago the upper closes at $84, will that close value change 5 min later (kinda like a darvas box)?
 
Hello everybody, can anyone create a VWAP watchlist when the Center of Gravity Crosses (COG) up or down. Also whether COG is above or below VWAP. This will certainly help determine entry/exit points.
 
@Ninja Bull You probably don't want to use the COG for entry or exits as this is a repainting indicator. IE: It gives a signal and then it takes it back as if saying "just kidding". My understanding when querying why anyone uses repainting indicators is that many use them as a heads up for potential movement which they then confirm with real indicators.
 
@Ninja Bull You probably don't want to use the COG for entry or exits as this is a repainting indicator. IE: It gives a signal and then it takes it back as if saying "just kidding". My understanding when querying why anyone uses repainting indicators is that many use them as a heads up for potential movement which they then confirm with real indicators.
something to point out is that every indicator is a repainting indicator to some extent, well at least most that i can think of are. i love repainting indicators because although they repaint they give the "best" signals (also the worst) because of the speed at which they do it.
 
@germanburrito I agree w/ you that Hursts like this one, give the "best" signals which are negated by also giving the worst. As I said to @Ninja Bull, the speed of these type of indicators do provide a heads-up that something might be happening. Analysis of price action and other indicators can then be used to prove veracity and entry and exit points.

I understand the attraction for the speed of repainting indicators for scalpers. I post warnings only when new investors, who may not realize the risk, post a query.

@germanburrito, I have learned a great deal from your contributions to this forum and respect your opinions. Not to hijack, so maybe in a new thread, I would like to hear more about your opinion that every indicator is a repainting indicator to some extent. As a technical analyst, I put STRONG reliance on my SMI, IFT, MACD, RSI, etc, second only to price action. To my knowledge: these and all other non-repainting / non-MTF indicators never repaint after the candle closes (hence being categorized as non-repainting). I would appreciate hearing your discourse on why you think I am wrong.
its just a silly idea i been thinking about, what does it mean for something to repaint or not? because you can say that its when the cadle closes it wont change but the same logic could be use for lets say zigzag, after a certain number of bars the zigzag wont change anymore, so then we are talking about time when it comes to repaint, because after a while zigzag wont change or certain calculations wont change, now lets look at rsi, rsi has a low, high and a close and it moves until the candle closes, i guess if you use the example of the indicator not changing when the candle closes we can say that it wont repaint, but if you are looking at a bigger time frame, lets say the 15 minute rsi on a 5 minute chart it could be constantly be moving from overbought to not overbought on a bigger time frame, until the 15 minutes is over, at the same time you can make zigzag so fast and responsive that it would follow price and it wont repaint. i know this sounds like obvious ideas but im just proposing a differetn way to look at indicators, and what indicators are doing. lets look at trailing atr, this is seen as one of the most static indicator but thats only because of its calculation. i been notincing that that alot of indicators are just ways of looking at the same data, the "change of averages"and averages are constantly changing, rsi is calculating the difference of averages and so is macd. maybe im over simplying things.
 
Thank you guys for your comments. I am going to share the chart http://tos.mx/2DlkvhN ---I also use the expected move as well as the 50 and 100 regression channels MACD BB. I has proven to be very successful combination.

hopefully you will see the need of a watchlist of the COG crossing VWAP and whether it is up or below VWAP
 

Not the exact question you're looking for?

Start a new thread and receive assistance from our community.

87k+ Posts
432 Online
Create Post

The Market Trading Game Changer

Join 2,500+ subscribers inside the useThinkScript VIP Membership Club
  • Exclusive indicators
  • Proven strategies & setups
  • Private Discord community
  • ‘Buy The Dip’ signal alerts
  • Exclusive members-only content
  • Add-ons and resources
  • 1 full year of unlimited support

Frequently Asked Questions

What is useThinkScript?

useThinkScript is the #1 community of stock market investors using indicators and other tools to power their trading strategies. Traders of all skill levels use our forums to learn about scripting and indicators, help each other, and discover new ways to gain an edge in the markets.

How do I get started?

We get it. Our forum can be intimidating, if not overwhelming. With thousands of topics, tens of thousands of posts, our community has created an incredibly deep knowledge base for stock traders. No one can ever exhaust every resource provided on our site.

If you are new, or just looking for guidance, here are some helpful links to get you started.

What are the benefits of VIP Membership?
VIP members get exclusive access to these proven and tested premium indicators: Buy the Dip, Advanced Market Moves 2.0, Take Profit, and Volatility Trading Range. In addition, VIP members get access to over 50 VIP-only custom indicators, add-ons, and strategies, private VIP-only forums, private Discord channel to discuss trades and strategies in real-time, customer support, trade alerts, and much more. Learn all about VIP membership here.
How can I access the premium indicators?
To access the premium indicators, which are plug and play ready, sign up for VIP membership here.
Back
Top