
Darth Tradicus
Member
Here's my trade today on SPY 1M along with another indicator that may help weed out more false signals. I spent last night flipping through the indicator library from this site, giving many different ones a try and from what I can tell, the Stoplight Indicator posted by Floydddd seems to work well as an additional confirmation. From what I've observed looking through the last few weeks, whenever the Big4 triggers and the Stoplight indicator has dots(above the bottom two rows of dots which are almost always there) it seems to confirm a legit reversal. When the dots aren't present most of the time it seems to be a fakeout or at least doesn't run very far. IMPORTANT** It for now only looks to work well on the 1 minute time frame, so it may need some tweaking for others. Here's today:
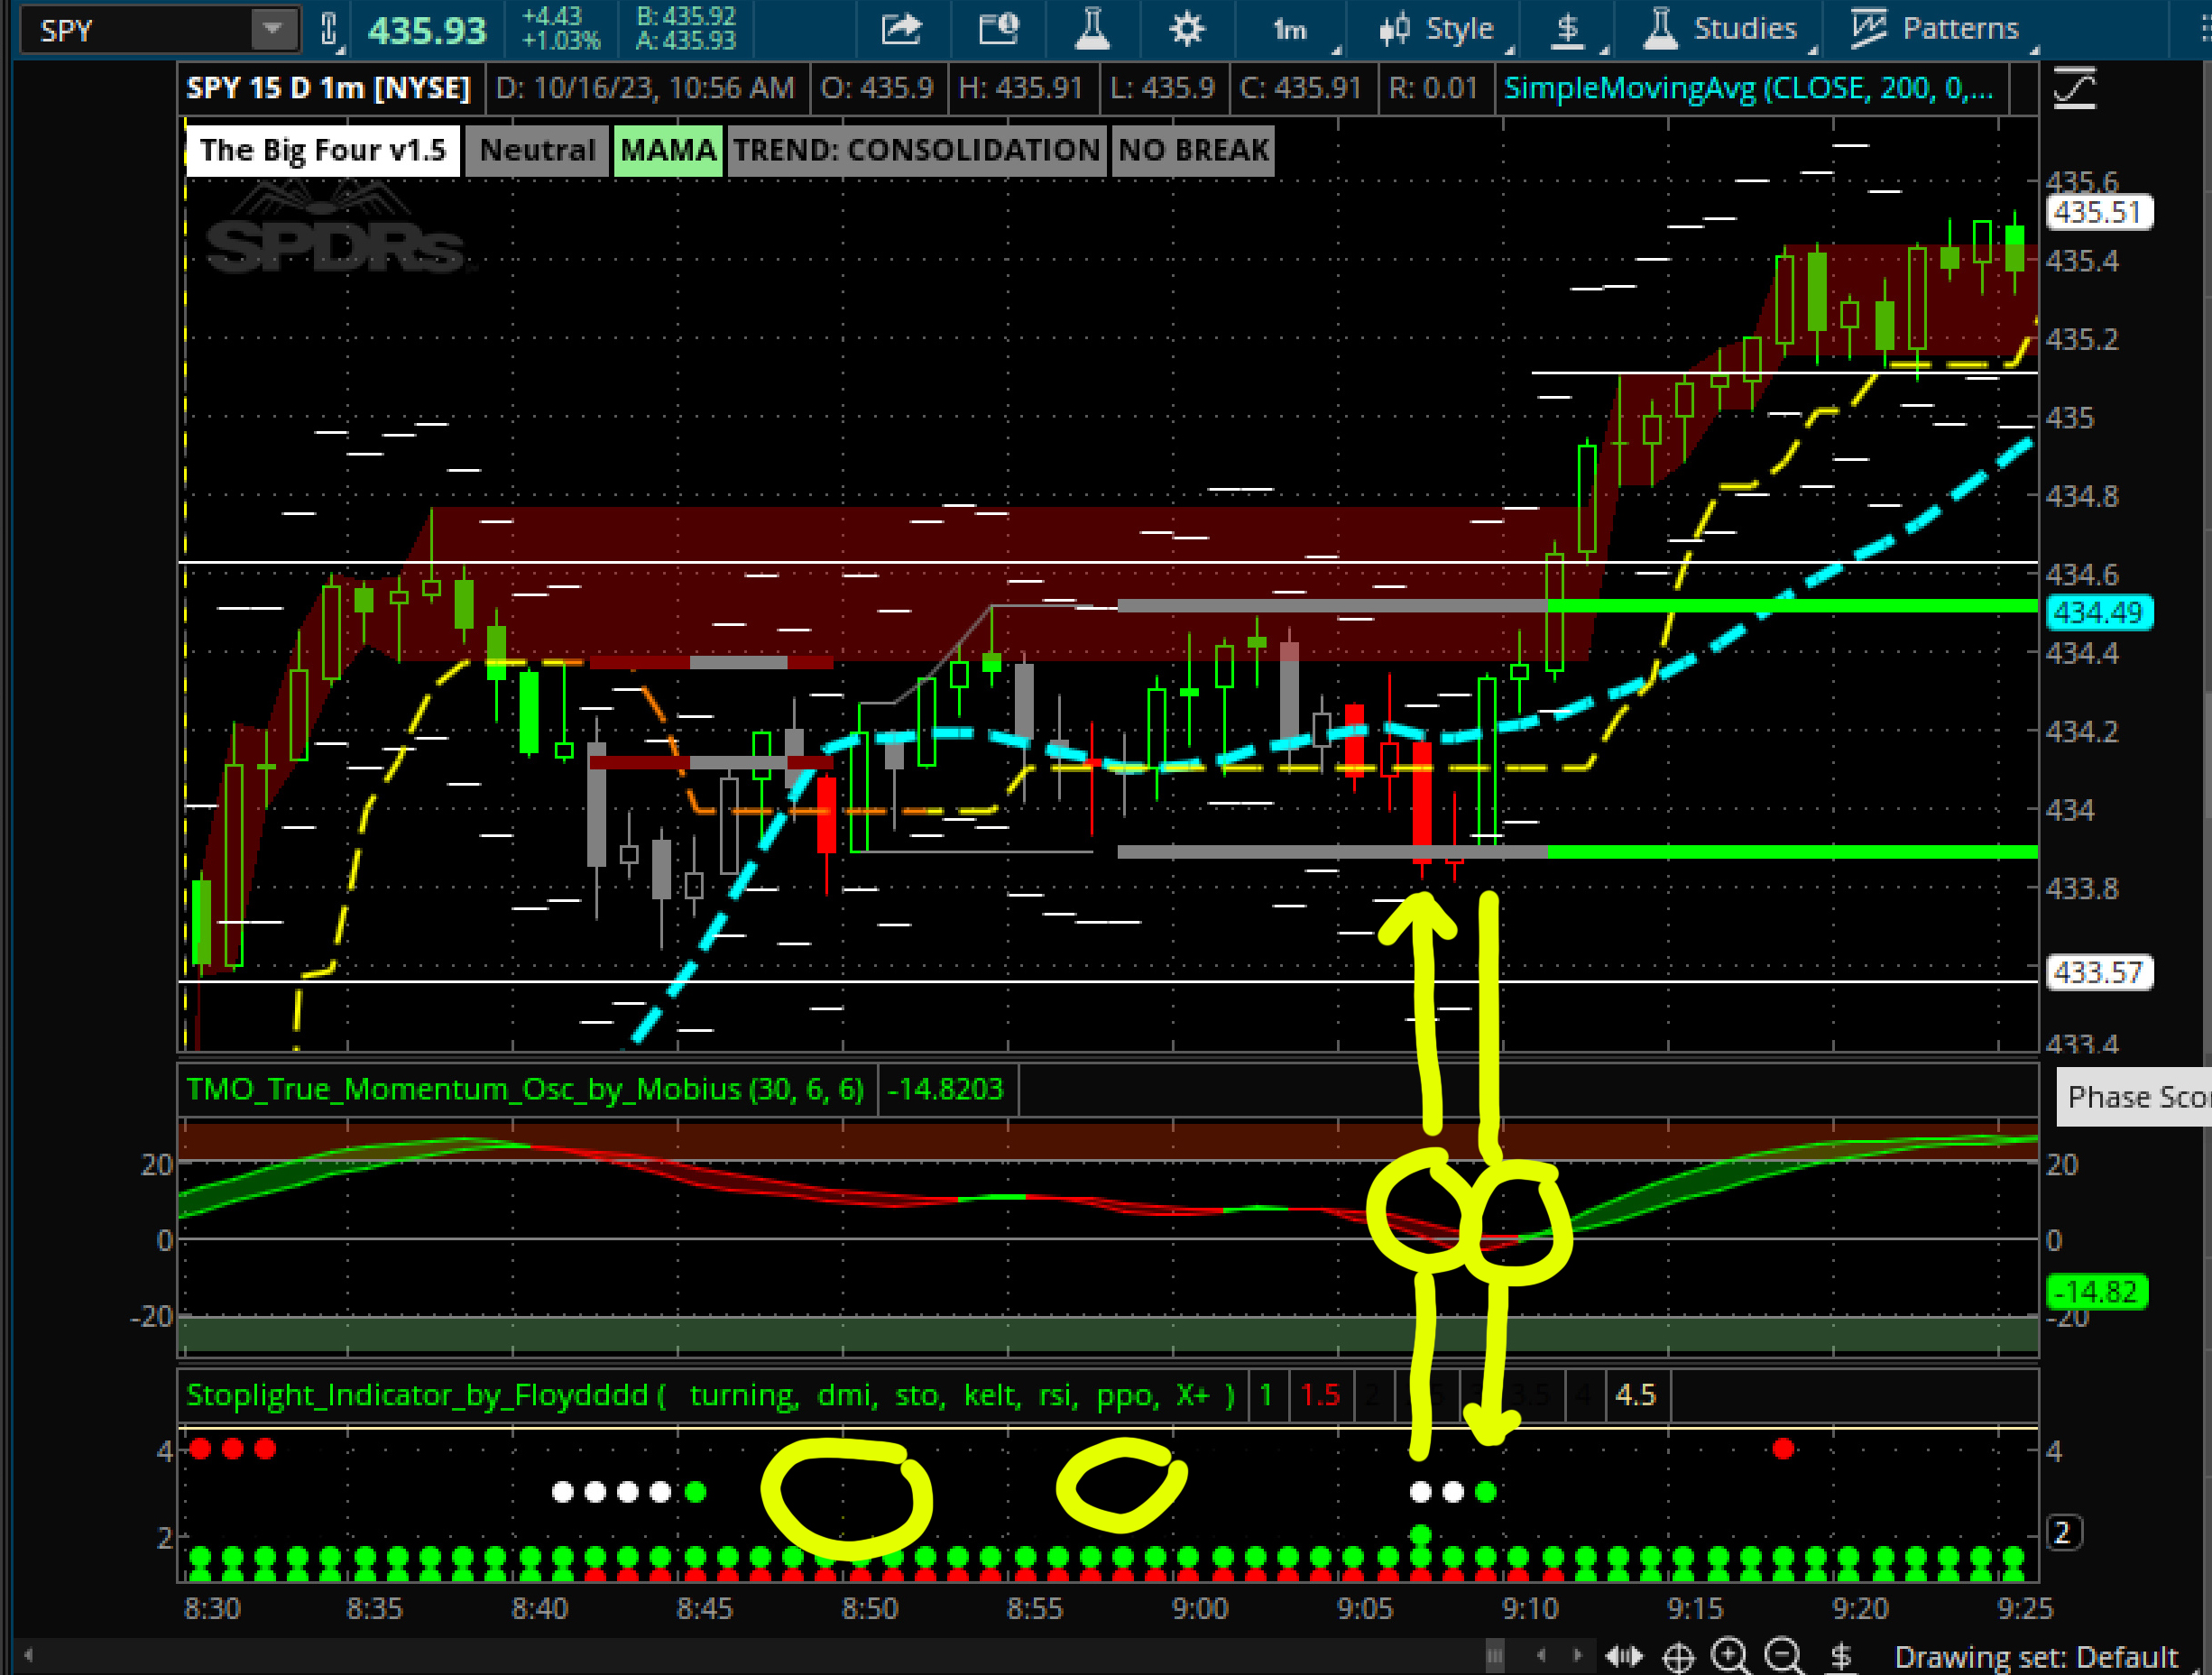
As you can see, as we were putting in lower highs near the HOD, I was looking for the color change for a reversal. 2 fakeouts that the Stoplight indicator caught. Note it did not catch the 3rd fakeout, however by then I had observed the chop and played it safe. Also note, we triggered LONG two candles later, but I stayed out because of the chop, preferring to see push above the HOD and pullback before entry but the darn thing just kept running... oh well.
Next here is my trade that came at around 10:16-
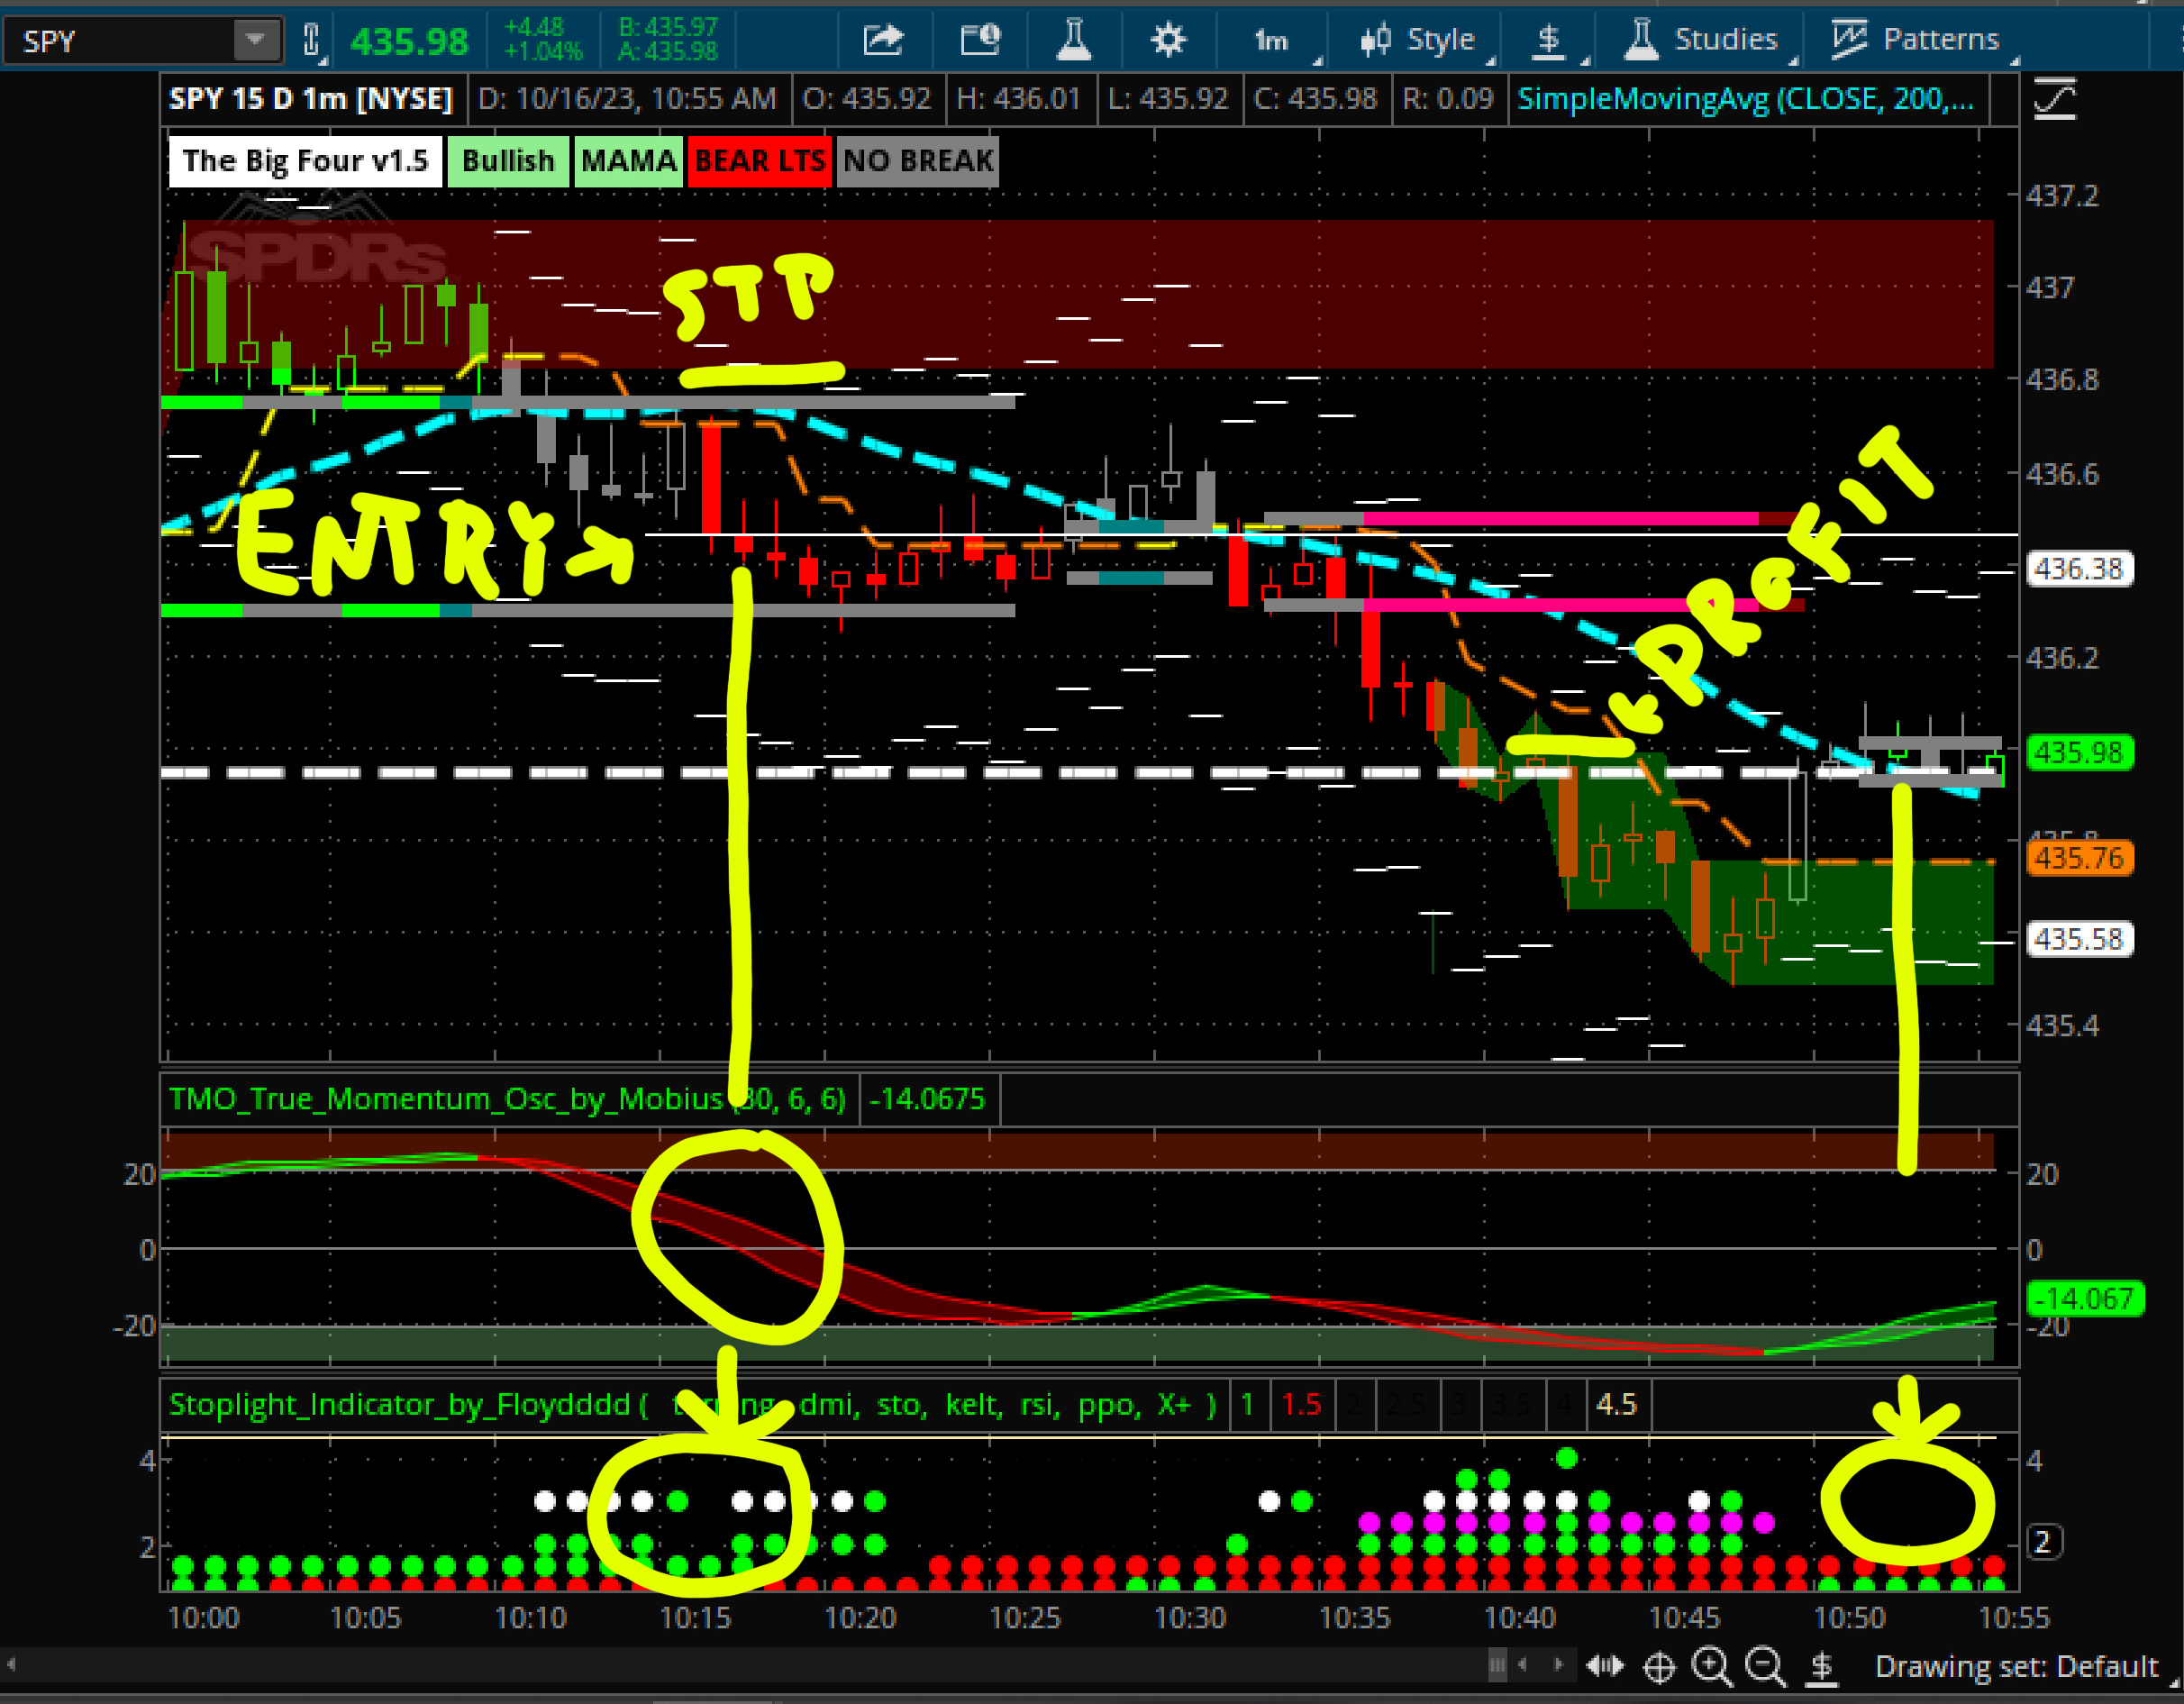
After missing that frustrating run up, Finally got the signal with dots on the Stoplight. Took the trade. It turned into a real chop downward, came close to stopping me but eventually broke. I lowered my stop first to break even and then just above Initial Balance High (1 HR HOD White Dash Line) hoping for it to trickle and chop it's way lower but I got stopped out by a bastard monster candle that popped up in a split second. Was up $40/contract but still ended up with $20. After that you can see that the Stoplight caught another fake signal and we've been chopping thru sideways garbage ever since.
I'm gonna keep the Stoplight as part of this trading setup for now as it seems to help a lot more than hurt. Like any confirmation, it will probably keep you out of a good trade every once in a while but seems to help more often than not. I looked at it on a few other time frames and it didn't seem to work, so it would probably need some tweaking from you modders. Odd to me that it works at all IMHO, as the Stoplight Indicator is meant to detect where the directional movement is putting on the brakes. But for now I'm just not gonna question it lol.
***Also forgot to mention, that Stoplight Dots don't seem to be necessary on a continuation of the trend- ex if you are short/red and you get a pullback that turns green(without dots) and goes nowhere but then just after you get a red candle + TMO confirmation, It looks like dots being there don't matter.
http://tos.mx/AKQy15E
Last edited:

