# horz_lines_colors
# https://usethinkscript.com/threads/horizontal-lines-per-user-input.16313/
# Horizontal Lines per user input
# test symbols zig, zim, zt, zy, zw
def bn = BarNumber();
def na = Double.NaN;
#def diffday = if GetDay() != GetDay()[1] then 1 else 0;
#------------------
# symbol1
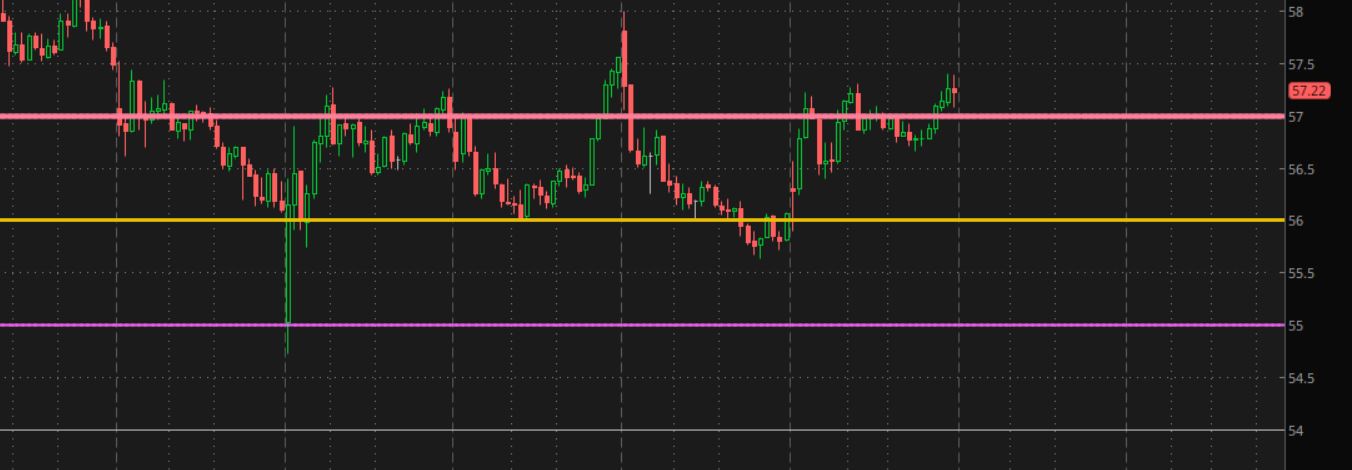
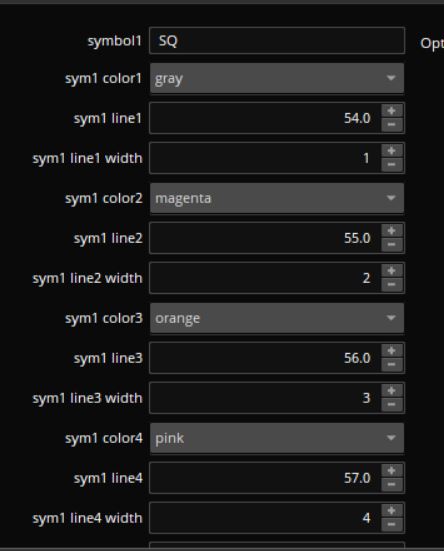
input Symbol1 = "zw";
# this doesn't assign the color in quotes.
# the location of the picked color in the series, is changed to a number
# ex. pink is the 3rd number. 2 is saved in color1_choice ( count starts at 0)
input sym1_color1 = {default "magenta", "cyan", "pink", "gray", "orange", "red", "green", "dark_gray", "yellow", "white"};
input sym1_line1 = 0.00;
input sym1_line1_width = 1;
input bubble_1 = yes;
input sym1_color2 = {default "magenta", "cyan", "pink", "gray", "orange", "red", "green", "dark_gray", "yellow", "white"};
input sym1_line2 = 0.00;
input sym1_line2_width = 1;
input bubble_2 = yes;
input sym1_color3 = {default "magenta", "cyan", "pink", "gray", "orange", "red", "green", "dark_gray", "yellow", "white"};
input sym1_line3 = 0.00;
input sym1_line3_width = 1;
input bubble_3 = no;
input sym1_color4 = {default "magenta", "cyan", "pink", "gray", "orange", "red", "green", "dark_gray", "yellow", "white"};
input sym1_line4 = 0.00;
input sym1_line4_width = 1;
input bubble_4 = no;
#def s1 = close(Symbol1);
plot z1a = if getsymbol() == symbol1 and sym1_line1 > 0 then sym1_line1 else na;
plot z1b = if getsymbol() == symbol1 and sym1_line2 > 0 then sym1_line2 else na;
plot z1c = if getsymbol() == symbol1 and sym1_line3 > 0 then sym1_line3 else na;
plot z1d = if getsymbol() == symbol1 and sym1_line4 > 0 then sym1_line4 else na;
z1a.SetDefaultColor(getcolor(sym1_color1));
z1b.SetDefaultColor(getcolor(sym1_color2));
z1c.SetDefaultColor(getcolor(sym1_color3));
z1d.SetDefaultColor(getcolor(sym1_color4));
z1a.setlineweight(sym1_line1_width);
z1b.setlineweight(sym1_line2_width);
z1c.setlineweight(sym1_line3_width);
z1d.setlineweight(sym1_line4_width);
z1a.SetStyle(Curve.SHORT_DASH);
z1b.SetStyle(Curve.SHORT_DASH);
z1c.SetStyle(Curve.SHORT_DASH);
z1d.SetStyle(Curve.SHORT_DASH);
AddChartBubble(bubble_1 and high==z1a,z1a,"Line 1: "+z1a, getcolor(sym1_color1));
AddChartBubble(bubble_2 and high==z1b,z1b,"Line 2: "+z1b, getcolor(sym1_color2));
AddChartBubble(bubble_3 and high==z1c,z1c,"Line 3: "+z1c, getcolor(sym1_color3));
AddChartBubble(bubble_4 and high==z1d,z1d,"Line 4: "+z1d, getcolor(sym1_color4));