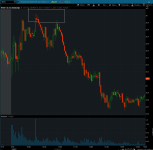
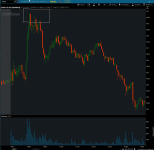
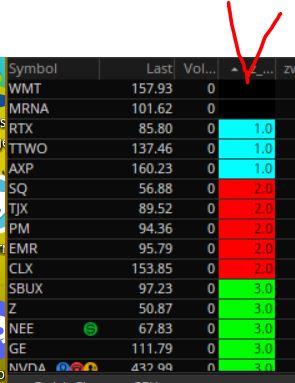
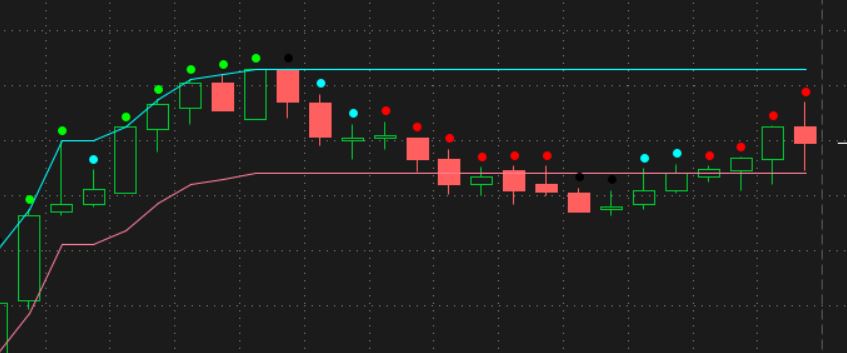
So i am looking for help to build a custom watchlist column that shows me when price is struggling with breaking the intraday HOD and keeps rejecting this area over multiple bars. So the watchlist column will paint red when price is within a HOD range, i am thinking HOD +- 1% away from hod price (or possibly 2%) will be good and i only want to see the column paint red when 3 or more bars have rejected this price area. See my attached images for examples of what i mean. So basically, when price is within the box and 3 or more bars have passed, the column turns red and if price goes below the box the column turns black again. Or if the price does breakout of box and make a new HOD, the column will also of course turn black again if/until the same conditions happens again.
So the conditions are,
1. When price is at HOD +- 1%
2. When price has rejected HOD range for 3 or more bars
If possible, it would be useful to know how many bars have passed by adding this number in the column. So for example, if 5 bars have passed, the column will count the bars and say 5.
So the conditions are,
1. When price is at HOD +- 1%
2. When price has rejected HOD range for 3 or more bars
If possible, it would be useful to know how many bars have passed by adding this number in the column. So for example, if 5 bars have passed, the column will count the bars and say 5.