That script lists the Average Daily Volume, not the percentage of the Average Daily Volume we are currently at.
It also doesn't calculate it correctly from what I can see. /ES for example has a 30 ADV of 1,503,943 and this script displays 1,268,722 after adjusting it to 30 days.
The script below is what I use to display the percentage on the chart.
I cannot translate it into a column script because the calculations are way off for some reason.
It will also freeze when aftermarket hours start and only reset when premarket hours start.
Hence I wanted to see if anyone already had a functioning column script and could share.
i'll guess futures data isn't gathered correctly because that study uses 2nd aggregation of day, which i think is 9:30 to 4, and futures are 4:45 to 4.
maybe if the code was changed to use,
RegularTradingStart()
RegularTradingend()
it would work?
def RTH = getTime() >= regularTradingStart(getYYYYMMDD()) and
getTime() <= regularTradingEnd(getYYYYMMDD());
i don't trade futures, so can't test code, so hopefully someone else can help.
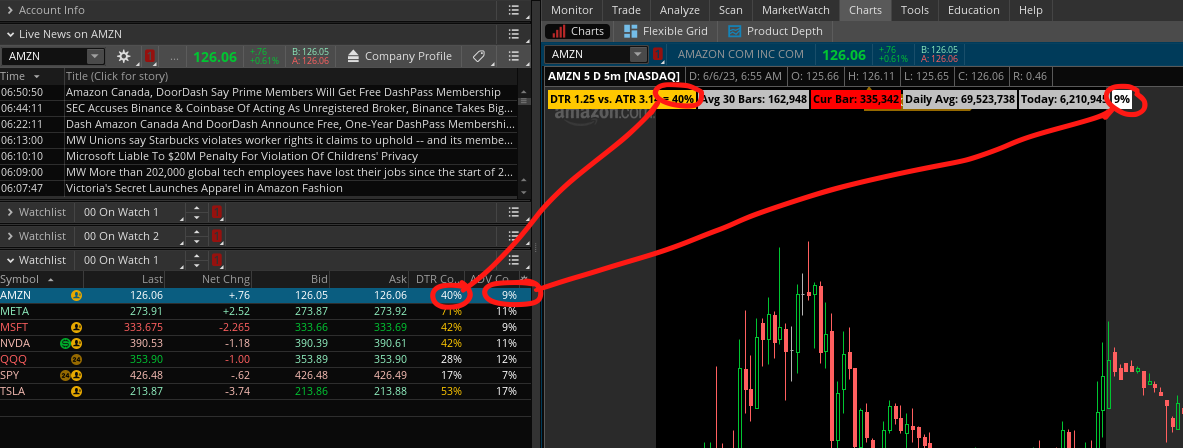
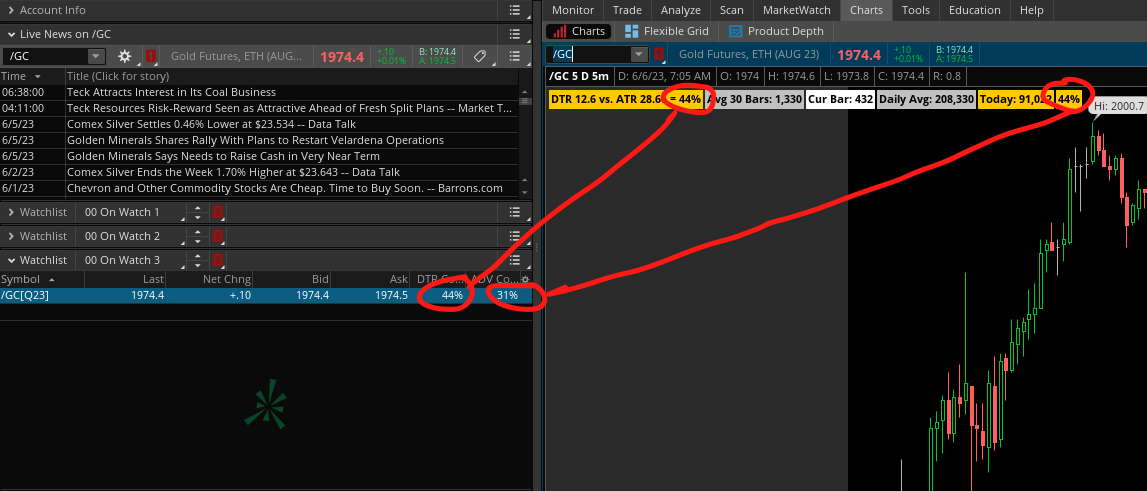
i explained this in a different thread. I noticed you are running the script on a 5 minute chart which is smaller than the Day chart. TD's tick data is dependent on their data source and is received in "bulk package". when it comes specifically to VOLUME and tick, Sometimes there will be a SLIGHT difference in it compared to other data sources. However the larger time frame (DAY timeframe) will normally fix this error to correctly reflect the total day's volume, however smaller timeframes may miss a few ticks and slightly differ when TD scripts attempt to grab the data on smaller time frames and attempt to add it to the OFFICIAL day's total volume. If you want true tick data you will have to find a different broker and platform and take note that you will probably have to pay for this kind of data and obtain a subscription. If tick is important you may want to look into https://www.cqg.com/
trust me i ran into the same problem on a volume script so i had researched it online and spent almost a whole day fiddling with different code to come to the same conclusion that i had read elsewhere thats its just the way TD grabs the tick data.
My personal advice would be to make the script run and calculate from the day aggregation to get a accurate calculation.
Thanks for your input. To clarify, the script on the chart is actually correct on all time frames, it's the script in the column that isn't calculating correctly.
Thanks for your input. To clarify, the script on the chart is actually correct on all time frames, it's the script in the column that isn't calculating correctly.
and from the code i see you are trying to grab the last 30 days, maybe the column is correct and your chart is wrong, remember the indicators can only grab what is visible on the chart, you have 5 days visible but trying to compare 30 days.
im seeing View attachment 19136
and from the code i see you are trying to grab the last 30 days, maybe the column is correct and your chart is wrong, remember the indicators can only grab what is visible on the chart, you have 5 days visible but trying to compare 30 days.
Thanks for taking a look. I'm working on 180 day charts and it doesn't work there either. I think it would take a high level coder to figure this one out.
useThinkScript is the #1 community of stock market investors using indicators and other tools to power their trading strategies. Traders of all skill levels use our forums to learn about scripting and indicators, help each other, and discover new ways to gain an edge in the markets.
How do I get started?
We get it. Our forum can be intimidating, if not overwhelming. With thousands of topics, tens of thousands of posts, our community has created an incredibly deep knowledge base for stock traders. No one can ever exhaust every resource provided on our site.
If you are new, or just looking for guidance, here are some helpful links to get you started.
VIP members get exclusive access to these proven and tested premium indicators: Buy the Dip, Advanced Market Moves 2.0, Take Profit, and Volatility Trading Range. In addition, VIP members get access to over 50 VIP-only custom indicators, add-ons, and strategies, private VIP-only forums, private Discord channel to discuss trades and strategies in real-time, customer support, trade alerts, and much more. Learn all about VIP membership here.
How can I access the premium indicators?
To access the premium indicators, which are plug and play ready, sign up for VIP membership here.