DTR vs ATR Indicator for ThinkorSwim

Shinthus

Active member
2019 Donor
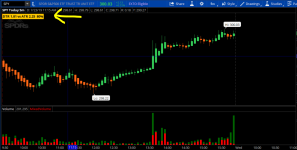
Ever wonder how much "steam" is left in the day with a particular instrument? If you day trade, this tool helps you decide whether it's worth taking more trades or calling it a day. It shows Daily True Range versus the Average True Range as a % in the upper left corner. I typically don't trade after the DTR reaches 100% but sometimes I'll apply that rule flexibly.

Image for reference:

X0q1Npm.png


Indicator code:

Code:
# Custom ATR Plot by 7of9 for BRT
# edited 3/20/19

declare upper;

input AtrAvgLength = 14;

def ATR = WildersAverage(TrueRange(high(period = aggregationPeriod.DAY), close(period = aggregationPeriod.DAY), low(period = aggregationPeriod.DAY)), AtrAvgLength);

def TodayHigh = Highest(high(period = aggregationPeriod.DAY), 1);
def TodayLow = Lowest(low(period = aggregationPeriod.DAY), 1);

def DTR = TodayHigh - TodayLow;

def DTRpct = Round((DTR / ATR) * 100, 0);

AddLabel (yes, "DTR " + Round (DTR , 2) + " vs ATR " + round (ATR,2)+ "  " + round (DTRpct,0) + "%", (if DTRpct <= 70 then Color.GREEN else if DTRpct >= 90 then Color.RED else Color.ORANGE));

Shareable link: https://tos.mx/Qimvmh
 

Attachments

  • X0q1Npm.png
    X0q1Npm.png
    140 KB · Views: 321
Last edited by a moderator:
I am new to ThinkScript, and trading Forex. I am trying to find a way to add a label to a chart that expresses Average True Range in USD even when USD is not on of the current charts currency pair. My current multi label script is a disaster lol. I have been making scripts for only 2 days so,... yeah its ugly.

Code:
# AA_Label_Fx_Tricolor_1_0
# 2019-07-16
# Matthew Jordan - Learning ThinkScript

# This script will add 4 labels to a Forex chart.
#    1. Current position in Lots.
#    2. Average True Range.
#    3. Average True Range converted to USD.(PER LOT)
#    4. Current Spread cost.
#
# These labels will be Ti-color coded,
# relating to the full range of the
# last (User set Length) bars on the
# current charts time frame.
#
#    Green    = The BEST 1/3 of that range.
#    Yellow   = The middle part of that range.
#    Red      = The WORST 1/3 of that range.        
# Green = Good, Yellow = Not Ideal & Red = Bad


# START User Defined Length in bars.
    input length = 252;
# END User Defined Length in bars.

# Start Define atrHi, atrLo, atrRange & atrPercentage.
    def atr
        = if IsNaN(atr())
        then atr[1]
        else atr();
    def atrHi
        = Highest(atr, length);
    def atrLo
        = Lowest (atr, length);
    def AtrRange
        = atrHi
        - atrLo;
    def atrPercentage
        = Round( 100
        * (atr() - atrLo)
        / AtrRange, 1) ;
# END Define atrHi, atrLo, atrRange & atr%.

# START Define BidPrice, AskPrice & FxSpread.
    def BidPrice
        = close(priceType = PriceType.BID);
    def AskPrice
        = close(priceType = PriceType.ASK);
    def FxSpread
        = AskPrice - BidPrice;
# END Define FxSpread.

# START Define FxSpread High, Lo, Range & Percentage.
   def SpreadHi
       = Highest(FxSpread, length);
   def SpreadLo
       = Lowest (FxSpread, length);
   def FxSpreadRange
       = SpreadHi
       - SpreadLo;
   def FxSpreadPerc
       = Round ((100 * FxSpread)
       / FxSpreadRange)
       / 100;
# END Define FxSpread High, Lo, Range & Percentage.

# START Define TrueATR & TickValue.
    def TrueATR
        = ATR
        - FxSpreadRange;
  def TickValue
        = if IsNaN(atr())
        then TickValue[1]
        else Tickvalue();
# END Define TrueATR & TickValue.

# START Define all 3 colors for Labels
    DefineGlobalColor("67%+", Color.RED);
    DefineGlobalColor("34-66%", Color.YELLOW);
    DefineGlobalColor("33%-", Color.GREEN);
# END Define all 3 colors for Labels

# START Add FxSpread label to chart in proper color.
    AddLabel(yes, "FxSpread " + FxSpread ,
    if FxSpreadPerc >66 then GlobalColor("67%+") else
    if FxSpreadPerc >33 then GlobalColor("34-66%") else
    GlobalColor("33%-"));
# END Add FxSpread label to chart in proper color.

# START Define TickSize & LotSize
     def TickSize
        = if IsNaN(tickSize())
        then tickSize[1] else
        tickSize();
     def LotSize = TickValue/Ticksize;
# END Define TickSize & Lotsize

# Start Add label for LotSize.
AddLabel(yes, "# Lots " + (LotSize / 100000));
# END Add label for LotSize.

# Start Add Tri-color label for ATR.
    AddLabel(yes, "ATR: " + atr ,
    if atrPercentage>66 then GlobalColor("33%-") else
    if atrPercentage>33 then GlobalColor("34-66%")else
    GlobalColor("67%+"));
# END Add Tri-color label for ATR.


# Start Add Tri-color label for ATR in USD.
    AddLabel(yes, "ATR= $"
    + (TickValue*LotSize)
    * TrueATR);
# END Add Tri-color label for ATR in USD.

# I highly suggest that you save as
#      AA_Label_Fx_Tricolor_1_0
[\CODE]
 
Last edited by a moderator:
Great script! Thanks for posting. I have seen stocks that move one direction towards a 100% ATR and still reverse and do the opposite sometimes after 12PM depending on what is going on. So my question is If the percentage recorded is over 100% doesn't that indicate some sort of reversal depending on what is going on with the stock? Since stocks moves in three directions, I am curious which direction you think a DTR that is over a 100% would favor? Or why is is not recommended to trade with a DTR that is above 100%?
 
This looks good. but what is the major difference between DTR and ATR calculation. Is it possible to put ATR = DTR * No times %? Can we add this a column for ATR || DTR on the Watch list?

I observed some of the DTR % 160 (NVDA). how to interpret and what is the indication for Long/Entry to buy a stock?
 
I observed some of the DTR % 160 (NVDA). how to interpret and what is the indication for Long/Entry to buy a stock?
@2sureshk DTR is just Days True Range and ATR is Average True Range. You would need to open the label or study, etc. and look at the code.
Also, Investopedia and School.StockCharts.com are 2 approved places to look for answers outside of tlc.ThinkorSwim.com.
 
I've found a great label indicator herein showing DTR vs. ATR, but I would like to see a price level, above and below present range, that indicates the level I need in order to reach ATR for the day. Is this possible?
 
@scottrades Per your request, here is a label that displays ATR High/Low thresholds relative to the daily open

Code:
# ATR Daily Range
# tomsk
# 12.16.2019

# Displays ATR High/Low thresholds relative to daily open

input length = 14;
input averageType = AverageType.WILDERS;

def o = open(period = AggregationPeriod.DAY);
def h = high(period = AggregationPeriod.DAY);
def l = low(period = AggregationPeriod.DAY);
def c = close(period = AggregationPeriod.DAY);

def ATRD = MovingAverage(averageType, TrueRange(h, c, l), length);

AddLabel(1, "Current Close = " + close, Color.YELLOW);
AddLabel(1, "ATR High/Low Level = [ " + Round(o+ATRD,2) + " / " + Round(o-ATRD,2) + " ]", Color.PINK);
# End ATR Daily Range

MINOR EDITS: Corrected some typos
 
Last edited:
Folks here is version 1.1 of the ATR Daily High Low Range/Threshold. I thought it might be helpful to determine the percentage performance relative to that range. If you see 100% then you're at the top of the range. A value like 26% tells you we are at the lower 26% of that range

Code:
# ATR Daily Range
# tomsk
# 12.16.2019

# V1.0 - 12.16.2019 - tomsk   - Initial release ATR Daily Range
# V1.1 - 12.16.2019 - tomsk   - Added performance relative to ATR range

# Displays ATR High/Low thresholds relative to daily open

input length = 14;
input averageType = AverageType.WILDERS;

def o = open(period = AggregationPeriod.DAY);
def h = high(period = AggregationPeriod.DAY);
def l = low(period = AggregationPeriod.DAY);
def c = close(period = AggregationPeriod.DAY);
def R = (c - l) / (h - l);
def ATRD = MovingAverage(averageType, TrueRange(h, c, l), length);

AddLabel(1, "ATR Daily High/Low Level = [ " + Round(o+ATRD,2) + " / " + Round(o-ATRD,2) + " ]", Color.PINK);
AddLabel(1, "Current Close = " + close + " [ " + AsPercent(R) + " ]", Color.YELLOW);

# End ATR Daily Range
 
Last edited:
@scottrades I corrected some minor typos and updated the version posted
Thank you, though I would like see actual price level lines drawn on the chart, not just the label...is that possible?

Edit: Thinking about this...presenting just a bubble for each would be ideal.
 
Last edited:
@scottrades Per your request, here is version 1.2 of the code that plots lines for the ATR High/Low levels
Load this study on say a daily chart of AMZN, you'll see it plots nicely, okay?

Code:
# ATR Daily Range
# tomsk
# 12.17.2019

# V1.0 - 12.16.2019 - tomsk   - Initial release ATR Daily Range
# V1.1 - 12.16.2019 - tomsk   - Added performance relative to ATR range
# V1.2 - 12.17.2019 - tomsk   - Added plot lines for ATR High/Low on the chart

# Displays ATR High/Low thresholds relative to daily open

input length = 14;
input averageType = AverageType.WILDERS;

def o = open(period = AggregationPeriod.DAY);
def h = high(period = AggregationPeriod.DAY);
def l = low(period = AggregationPeriod.DAY);
def c = close(period = AggregationPeriod.DAY);
def R = (c - l) / (h - l);
def ATRD = MovingAverage(averageType, TrueRange(h, c, l), length);
def ATRH = o + ATRD;
def ATRL = o - ATRD;

AddLabel(1, "ATR Daily High/Low Level = [ " + Round(ATRH,2) + " / " + Round(ATRL,2) + " ]", Color.PINK);
AddLabel(1, "Current Close = " + close + " [ " + AsPercent(R) + " ]", Color.YELLOW);

def LBN = if isNaN(close[-1]) and !isNaN(close) then barnumber() else Double.NaN;
plot ATR_High = if barNumber() >= highestAll(LBN)
                then highestAll(if isNaN(close[-1]) then ATRH else Double.NaN)
                else Double.NaN;
ATR_High.SetLineWeight(2);
ATR_High.SetDefaultColor(Color.Cyan);

plot ATR_Low = if barNumber() >= highestAll(LBN)
               then highestAll(if isNaN(close[-1]) then ATRL else Double.NaN) else Double.NaN;
ATR_Low.SetLineWeight(2);
ATR_Low.SetDefaultColor(Color.Yellow);
# End ATR Daily Range
 
@tomsk Script not re-calculating. For example, see $ROKU chart image below. Based on the HOD, the low end of the ATR should reflect 131.78. However, it's still showing 128.68, which was correct at open.
 
Last edited:
@scottrades I've loaded that study on ROKU, the ATR Daily High is 142.66 and the ATR daily low is 128.68. Hence it does recalculate just fine
 
@scottrades I've loaded that study on ROKU, the ATR Daily High is 142.66 and the ATR daily low is 128.68. Hence it does recalculate just fine
I would like the study to adjust throughout the trading day, not simply provide markers at open. Using the chart example above, ROKU rose to 138.77 around 10:00; the downside ATR would then need to be adjusted to 131.78, to keep the ATR.
 

Join useThinkScript to post your question to a community of 21,000+ developers and traders.

Similar threads

Not the exact question you're looking for?

Start a new thread and receive assistance from our community.

87k+ Posts
466 Online
Create Post

Similar threads

Similar threads

The Market Trading Game Changer

Join 2,500+ subscribers inside the useThinkScript VIP Membership Club
  • Exclusive indicators
  • Proven strategies & setups
  • Private Discord community
  • ‘Buy The Dip’ signal alerts
  • Exclusive members-only content
  • Add-ons and resources
  • 1 full year of unlimited support

Frequently Asked Questions

What is useThinkScript?

useThinkScript is the #1 community of stock market investors using indicators and other tools to power their trading strategies. Traders of all skill levels use our forums to learn about scripting and indicators, help each other, and discover new ways to gain an edge in the markets.

How do I get started?

We get it. Our forum can be intimidating, if not overwhelming. With thousands of topics, tens of thousands of posts, our community has created an incredibly deep knowledge base for stock traders. No one can ever exhaust every resource provided on our site.

If you are new, or just looking for guidance, here are some helpful links to get you started.

What are the benefits of VIP Membership?
VIP members get exclusive access to these proven and tested premium indicators: Buy the Dip, Advanced Market Moves 2.0, Take Profit, and Volatility Trading Range. In addition, VIP members get access to over 50 VIP-only custom indicators, add-ons, and strategies, private VIP-only forums, private Discord channel to discuss trades and strategies in real-time, customer support, trade alerts, and much more. Learn all about VIP membership here.
How can I access the premium indicators?
To access the premium indicators, which are plug and play ready, sign up for VIP membership here.
Back
Top