
thanks Sleepyz, can you add the Fibonacchi lines, the retracement/Extension are shown but the lines are not shown, thanks,It looks like the indicator code you are referencing is the code used in the image in post #1. The main code difference is input atrreversal = 1.0; Change that to 5.0. Otherwise, the image appears to be set with extended hours turned off. I was able to match the image in Ondemand. There is some problem with the bubble code displaying multiple fib bubbles in the BenTen version though.
{Edit- I fixed the bubbles]
You are using an out of date browser. It may not display this or other websites correctly.
You should upgrade or use an alternative browser.
You should upgrade or use an alternative browser.
Repaints ZigZag High Low with Supply & Demand Zones for ThinkorSwim
Repaints
The lines are showing for me when using the last code I posted above. Make sure the inputs are selected to show the lines and other items as you want.thanks Sleepyz, can you add the Fibonacchi lines, the retracement/Extension are shown but the lines are not shown, thanks,
Last edited:
Can anyone help with a scanner using this study ZigZag high low with supply and demand. I am looking for a scanner that can find stocks that have closed price greater than or equal to the lower supply and less than or equal to upper demand zone. I have tried doing this in TOS but it keeps failing giving error that the script is too complex. Appreciate your help. Many thanks.
https://usethinkscript.com/threads/...d-zones-for-thinkorswim.172/page-3#post-51283Can anyone help with a scanner using this study ZigZag high low with supply and demand. I am looking for a scanner that can find stocks that have closed price greater than or equal to the lower supply and less than or equal to upper demand zone. I have tried doing this in TOS but it keeps failing giving error that the script is too complex. Appreciate your help. Many thanks.
HauteToddly
New member
Is there a way to get the data to update real-time? So we don’t have delayed surprises? Thank you so much
Due to the drain that full range functions have on the platform, TDA no longer updates these types of calculations real-time.Is there a way to get the data to update real-time? So we don’t have delayed surprises? Thank you so much
They have no plans on fixing this.
Read more here: https://usethinkscript.com/threads/...-range-lagging-issues-due-to-tos-update.8794/
Here is TDA's official response:
https://usethinkscript.com/threads/...ing-issues-due-to-tos-update.8794/#post-72937
Last edited:
HauteToddly
New member
Very helpful. Lots of detail. Thank you very muchDue to the drain that full range functions have on the platform, TDA changed these functions to delay updating.
They have no plans on fixing this.
Read more here: https://usethinkscript.com/threads/...-range-lagging-issues-due-to-tos-update.8794/
Here is TDA's official response:
https://usethinkscript.com/threads/...ing-issues-due-to-tos-update.8794/#post-72937
Can you please provide the codes for the chart shown above with the arrows, and supply and demand line. I entered the above codes but the chart shown was not the same as above. ThanksThe alert is written in but I'm not getting the Bell Sound for example when the up arrow shows up. Is there a way to fix this or is it just me that's having the problem?
Daughters Keeper
New member
# ZigZag High Low Supply DemandCan you please provide the codes for the chart shown above with the arrows, and supply and demand line. I entered the above codes but the chart shown was not the same as above. Thanks
# ZigZag High Low modified in part by Linus' and Lar's code
# ZZZ, with modifications by tomsk
# 1.12.2020
# https://usethinkscript.com/threads/...d-zones-for-thinkorswim.172/page-2#post-13790
# V1.0 - 10.09.2016 - ZZZ - Initial release of ZigZag High Low Supply Demand
# V1.1 - 06.28.2017 - tomsk - Sectionalized code, and rearranged flow of some ZZ Logic
# V1.2 - 01.12.2020 - tomsk - Removed Fibonacci related code per user request
input showBubblesChange = no; # Price Change between Zigzags
input showBubblesPrice = no; # Price at Zigzag High/Low
input showBubblesBarCount = no; # Bar Count between Zigzags
input showBubblesVolume = no; # Volume at Zigzag Reversals
input showArrows = no;
input useAlerts = no;
input numberSuppDemandToShow = 2;
input showSupplyDemand = {default Pivot, Arrow, None};
input showSupplyDemandCloud = yes;
input BubbleOffset = .50000;
input PercentAmount = .01;
input RevAmount = .15;
input ATRreversal = 1.0;
input ATRlength = 5;
def zz = ZigZagHighLow("price h" = high, "price l" = low, "percentage reversal" = PercentAmount,
"absolute reversal" = RevAmount, "atr length" = ATRlength, "atr reversal" = ATRreversal);
def ReversalAmount = if (close * PercentAmount / 100) > Max(RevAmount < ATRreversal * ATRlength, RevAmount)
then (close * PercentAmount / 100)
else if RevAmount < ATRreversal * ATRlength
then ATRreversal * ATRlength
else RevAmount;
# Zig Zag Specific Data
def zzSave = if !IsNaN(zz) then zz else GetValue(zzSave, 1);
def chg = (if zzSave == high then high else low) - GetValue(zzSave, 1);
def isUp = chg >= 0;
def isConf = AbsValue(chg) >= ReversalAmount or (IsNaN(GetValue(zz, 1)) and GetValue(isConf, 1));
# Price Change Between ZigZags
def xxHigh = if zzSave == high then high else xxHigh[1];
def chgHigh = high - xxHigh[1];
def xxLow = if zzSave == low then low else xxLow[1];
def chgLow = low - xxLow[1];
# Bar Count Between ZigZags
def zzCount = if zzSave[1] != zzSave then 1 else if zzSave[1] == zzSave then zzCount[1] + 1 else 0;
def zzCountHiLo = if zzCountHiLo[1] == 0 and (zzSave == high or zzSave == low) then 1
else if zzSave == high or zzSave == low then zzCountHiLo[1] + 1
else zzCountHiLo[1];
def zzHiLo = if zzSave == high or zzSave == low then zzCountHiLo else zzCountHiLo + 1;
def zzCountHigh = if zzSave == high then zzCount[1] else Double.NaN;
def zzCountLow = if zzSave == low then zzCount[1] else Double.NaN;
# Volume at Reversals
def vol = if BarNumber() == 0 then 0 else volume + vol[1];
def vol1 = if BarNumber() == 1 then volume else vol1[1];
def xxVol = if zzSave == high or zzSave == low then TotalSum(volume) else xxVol[1];
def chgVol = if xxVol - xxVol[1] + vol1 == vol then vol else xxVol - xxVol[1];
# Label for Confirmed/Unconfirmed Status of Current Zigzag
AddLabel(BarNumber() != 1, (if isConf then "Confirmed " else "Unconfirmed ") + "ZigZag: " + chg,
if !isConf then Color.Dark_Orange else if isUp then Color.Green else Color.Red);
# Zig Zag Plot
plot zzp = if isUp <= 1 then zz else Double.NaN;
zzp.AssignValueColor(if isUp then Color.Green else if !isUp then Color.Red else Color.Dark_Orange);
zzp.SetStyle(Curve.FIRM);
zzp.EnableApproximation();
plot zzdot = if isUp <= 1 then zz else Double.NaN;
zzdot.setpaintingStrategy(paintingStrategy.POINTS);
zzdot.setlineWeight(5);
zzdot.assignvalueColor(if zzsave==high then color.yellow else color.blue);
# Bubbles
# Price Change between Zigzags
AddChartBubble(showBubblesChange and !IsNaN(zz) and BarNumber() != 1, if isUp then high * (1 + BubbleOffset) else low * (1 - BubbleOffset), "$" + chg, if isUp and chgHigh > 0 then Color.Green else if isUp and chgHigh < 0 then Color.Red else if isUp then Color.Yellow else if !isUp and chgLow > 0 then Color.Green else if !isUp and chgLow < 0 then Color.Red else Color.Yellow, isUp);
# Price at Zigzag High/Low
AddChartBubble(showBubblesPrice and !IsNaN(zz) and BarNumber() != 1, if isUp then high * (1 + BubbleOffset) else low * (1 - BubbleOffset), if isUp then "$" + high else "$" + low , if isUp and chgHigh > 0 then Color.Green else if isUp and chgHigh < 0 then Color.Red else if isUp then Color.Yellow else if !isUp and chgLow > 0 then Color.Green else if !isUp and chgLow < 0 then Color.Red else Color.Yellow, isUp);
# Bar Count between Zigzags
AddChartBubble(showBubblesBarCount and !IsNaN(zz) and BarNumber() != 1, if isUp then high * (1 + BubbleOffset) else low * (1 - BubbleOffset), if zzSave == high then zzCountHigh else zzCountLow, if isUp and chgHigh > 0 then Color.Green else if isUp and chgHigh < 0 then Color.Red else if isUp then Color.Yellow else if !isUp and chgLow > 0 then Color.Green else if !isUp and chgLow < 0 then Color.Red else Color.Yellow, if isUp then yes else no );
# Volume at Zigzag Reversals
AddChartBubble(showBubblesVolume and !IsNaN(zz) and BarNumber() != 1, if isUp then high * (1 + bubbleoffset) else low * (1 - bubbleoffset), chgVol,if isUp and chghigh > 0 then Color.Green else if isUp and chghigh < 0 then Color.Red else if isUp then Color.Yellow else if !isUp and chglow > 0 then Color.Green else if !isUp and chglow < 0 then Color.Red else Color.Yellow, if isUp then yes else no );
# Arrows
def zzL = if !IsNaN(zz) and !isUp then low else GetValue(zzL, 1);
def zzH = if !IsNaN(zz) and isUp then high else GetValue(zzH, 1);
def dir = CompoundValue(1, if zzL != zzL[1] or low == zzL[1] and low == zzSave then 1
else if zzH != zzH[1] or high == zzH[1] and high == zzSave then -1
else dir[1], 0);
def signal = CompoundValue(1, if dir > 0 and low > zzL
then if signal[1] <= 0 then 1 else signal[1]
else if dir < 0 and high < zzH
then if signal[1] >= 0 then -1 else signal[1]
else signal[1], 0);
plot U1 = showArrows and signal > 0 and signal[1] <= 0;
U1.SetPaintingStrategy(PaintingStrategy.BOOLEAN_ARROW_UP);
U1.SetDefaultColor(Color.Green);
U1.SetLineWeight(4);
plot D1 = showArrows and signal < 0 and signal[1] >= 0;
D1.SetPaintingStrategy(PaintingStrategy.BOOLEAN_ARROW_DOWN);
D1.SetDefaultColor(Color.Red);
D1.SetLineWeight(4);
# Alerts
Alert(useAlerts and U1, "ZIG-UP", Alert.BAR, Sound.Bell);
Alert(useAlerts and D1, "ZAG-DOWN", Alert.BAR, Sound.Chimes);
# Supply Demand Areas
def data1 = CompoundValue(1, if (zzSave == high or zzSave == low) then data1[1] + 1 else data1[1], 0);
def dataCount1 = (HighestAll(data1) - data1[1]);
def idx = showSupplyDemand == showSupplyDemand.Pivot;
def rLow;
def rHigh;
if signal crosses 0 {
rLow = low[idx];
rHigh = high[idx];
} else {
rLow = rLow[1];
rHigh = rHigh[1];
}
plot HighLine = if dataCount1 <= numberSuppDemandToShow and
showSupplyDemand != showSupplyDemand.None and
!isNaN(close) and
rHigh != 0
then rHigh
else Double.NaN;
HighLine.SetPaintingStrategy(PaintingStrategy.HORIZONTAL);
HighLine.AssignValueColor(if signal > 0 then Color.Green else Color.Red);
plot LowLine = if dataCount1 <= numberSuppDemandToShow and
showSupplyDemand != showSupplyDemand.None and
!isNaN(close) and
rLow != 0
then rLow
else Double.NaN;
LowLine.SetPaintingStrategy(PaintingStrategy.HORIZONTAL);
LowLine.AssignValueColor(if signal > 0 then Color.Green else Color.Red);
def hlUp = if signal > 0 then HighLine else Double.NaN;
def hlDn = if signal < 0 then HighLine else Double.NaN;
AddCloud(if showSupplyDemandCloud then hlUp else Double.NaN, LowLine, Color.Light_Green, Color.Light_Green);
AddCloud(if showSupplyDemandCloud then hlDn else Double.NaN, LowLine, Color.Light_Red, Color.Light_Red);
#Moification per Usethinkscript request to draw lines form one zzlow to another and the same for zzhigh to another zzhigh
def shsl_low = if zzsave==low then zz else shsl_low[1];
plot swinglow = shsl_low;
swinglow.enableApproximation();
def slcolor = if swinglow != swinglow[1] and swinglow > swinglow[1]
then 1
else if slcolor[1] == 1 and swinglow == swinglow[1]
then 1
else 0;
swinglow.assignvalueColor(if slcolor == 1 then color.green else color.red);
swinglow.setlineWeight(3);
def shsl_high = if zzsave==high then zz else shsl_high[1];
plot swinghigh = shsl_high;
swinghigh.enableApproximation();
swinghigh.setlineWeight(3);
def shcolor = if swinghigh != swinghigh[1] and swinghigh > swinghigh[1]
then 1
else if slcolor[1] == 1 and swinghigh == swinghigh[1]
then 1
else 0;
swinghigh.assignvalueColor(if shcolor == 1 then color.green else color.red);
# End ZigZag High Low Supply Demand
Last edited by a moderator:
jgarvais07
New member
Hello everyone,
I love this custom script (ZigZag High Low with Supply DemandIndex and Fibs_Linus_Lar), and find the arrows very useful. I would like to have a watchlist widget that shows when the arrow up/down occurs, but can't seem to figure out how to make one. Please help!
Code:
# Archive Name: ZigZag High Low with Supply DemandIndex and Fibs_Linus_Lar
# Archive Section: Scripts
# Suggested Tos Name: ZigZagHighLow_SupplyDemand_FibExtensions_LinusLar
# Archive Date:
# Archive Notes:
#TOS version ZigZagHighLow modified in part by Linus' and Lar's code
input bubbleoffset = .0005;
input percentamount = .01;
input revAmount = .15;
input atrreversal = 1.0;
input atrlength = 5;
def zz = ZigZagHighLow("price h" = high, "price l" = low, "percentage reversal" = percentAmount, "absolute reversal" = revAmount, "atr length" =atrlength, "atr reversal" = atrreversal);
def reversalAmount = if (close * percentamount / 100) > Max(revAmount < atrreversal * atrlength, revAmount) then (close * percentamount / 100) else if revAmount < atrreversal * atrlength then atrreversal * atrlength else revAmount;
rec zzSave = if !IsNaN(zz) then zz else GetValue(zzSave, 1);
def chg = (if zzSave == high then high else low) - GetValue(zzSave, 1);
def isUp = chg >= 0;
rec isConf = AbsValue(chg) >= reversalAmount or (IsNaN(GetValue(zz, 1)) and GetValue(isConf, 1));
def zzd = if isUp then 1 else 0;
plot zzp = if zzd <= 1 then zz else Double.NaN;
zzp.AssignValueColor(if zzd == 1 then Color.GREEN else if zzd == 0 then Color.RED else Color.DARK_ORANGE);
zzp.SetStyle(Curve.FIRM);
zzp.EnableApproximation();
#Price Change between zigzags
def xxhigh = if zzSave == high then high else xxhigh[1];
def chghigh = high - xxhigh[1];
def xxlow = if zzSave == low then low else xxlow[1];
def chglow = low - xxlow[1];
input showBubbleschange = yes;
AddChartBubble(showBubbleschange and !IsNaN(zz) and BarNumber() != 1, if isUp then high * (1 + bubbleoffset) else low * (1 - bubbleoffset) , "$" + chg , if isUp and chghigh > 0 then Color.GREEN else if isUp and chghigh < 0 then Color.RED else if isUp then Color.YELLOW else if !isUp and chglow > 0 then Color.GREEN else if !isUp and chglow < 0 then Color.RED else Color.YELLOW, isUp);
#Price at High/Low
input showBubblesprice = no;
AddChartBubble(showBubblesprice and !IsNaN(zz) and BarNumber() != 1, if isUp then high * (1 + bubbleoffset) else low * (1 - bubbleoffset) , if isUp then "$" + high else "$" + low , if isUp and chghigh > 0 then Color.GREEN else if isUp and chghigh < 0 then Color.RED else if isUp then Color.YELLOW else if !isUp and chglow > 0 then Color.GREEN else if !isUp and chglow < 0 then Color.RED else Color.YELLOW, isUp);
#Label for Confirmed/Unconfirmed Status of Current Zigzag
AddLabel(BarNumber() != 1, (if isConf then "Confirmed " else "Unconfirmed ") + "ZigZag: " + chg, if !isConf then Color.DARK_ORANGE else if isUp then Color.GREEN else Color.RED);
#Bar Count between zigzags
rec zzcount = if zzSave[1] != zzSave then 1 else if zzSave[1] == zzSave then zzcount[1] + 1 else 0;
def zzcounthilo = if zzcounthilo[1] == 0 and (zzSave == high or zzSave == low) then 1 else if zzSave == high or zzSave == low then zzcounthilo[1] + 1 else zzcounthilo[1];
def zzhilo = if zzSave == high or zzSave == low then zzcounthilo else zzcounthilo + 1;
def zzcounthigh = if zzSave == high then zzcount[1] else Double.NaN;
def zzcountlow = if zzSave == low then zzcount[1] else Double.NaN;
input showBubblesbarcount = no;
AddChartBubble(showBubblesbarcount and !IsNaN(zz) and BarNumber() != 1, if isUp then high * (1 + bubbleoffset) else low * (1 - bubbleoffset) , if zzSave == high then zzcounthigh else zzcountlow, if isUp and chghigh > 0 then Color.GREEN else if isUp and chghigh < 0 then Color.RED else if isUp then Color.YELLOW else if !isUp and chglow > 0 then Color.GREEN else if !isUp and chglow < 0 then Color.RED else Color.YELLOW, if isUp then yes else no );
#Arrows
def zzL = if !IsNaN(zz) and !isUp then low else GetValue(zzL, 1);
def zzH = if !IsNaN(zz) and isUp then high else GetValue(zzH, 1);
def dir = CompoundValue(1, if zzL != zzL[1] or low==zzl[1] and low==zzsave then 1 else if zzH != zzH[1] or high==zzh[1] and high==zzsave then -1 else dir[1], 0);
def signal = CompoundValue(1, if dir > 0 and low > zzL then if signal[1] <= 0 then 1 else signal[1] else if dir < 0 and high < zzH then if signal[1] >= 0 then -1 else signal[1] else signal[1], 0);
input showarrows = no;
plot U1 = showarrows and signal > 0 and signal[1] <= 0;
U1.SetPaintingStrategy(PaintingStrategy.BOOLEAN_ARROW_UP);
U1.SetDefaultColor(Color.GREEN);
U1.SetLineWeight(4);
plot D1 = showarrows and signal < 0 and signal[1] >= 0;
D1.SetPaintingStrategy(PaintingStrategy.BOOLEAN_ARROW_DOWN);
D1.SetDefaultColor(Color.RED);
D1.SetLineWeight(4);
#Alerts
input usealerts = no;
Alert(usealerts and U1, "ZIG-UP", Alert.BAR, Sound.Bell);
Alert(usealerts and D1, "ZAG-DOWN", Alert.BAR, Sound.Chimes);
#Supply Demand Areas
rec data1 = CompoundValue(1, if (zzSave == high or zzSave == low) then data1[1] + 1 else data1[1], 0);
def datacount1 = (HighestAll(data1) - data1[1]);
input numbersuppdemandtoshow = 2;
input showSupplyDemand = {default Pivot, Arrow, None};
def idx = if showSupplyDemand == showSupplyDemand.Pivot then 1 else 0;
def rLow;
def rHigh;
if signal crosses 0 {
rLow = low[idx];
rHigh = high[idx];
} else {
rLow = rLow[1];
rHigh = rHigh[1];
}
plot HighLine = if datacount1 <= numbersuppdemandtoshow and showSupplyDemand != showSupplyDemand.None and !isNaN(close) and rHigh != 0 then rHigh else Double.NaN;
HighLine.SetPaintingStrategy(PaintingStrategy.HORIZONTAL);
HighLine.AssignValueColor(if signal > 0 then Color.GREEN else Color.RED);
plot LowLine = if datacount1 <= numbersuppdemandtoshow and showSupplyDemand != showSupplyDemand.None and !isNaN(close) and rLow != 0 then rLow else Double.NaN;
LowLine.SetPaintingStrategy(PaintingStrategy.HORIZONTAL);
LowLine.AssignValueColor(if signal > 0 then Color.GREEN else Color.RED);
def hlUp = if signal > 0 then HighLine else Double.NaN;
def hlDn = if signal < 0 then HighLine else Double.NaN;
input showsupplydemandcloud = yes;
AddCloud(if showsupplydemandcloud then hlUp else double.nan, LowLine, Color.LIGHT_GREEN, Color.LIGHT_GREEN);
AddCloud(if showsupplydemandcloud then hlDn else double.nan, LowLine, Color.LIGHT_RED, Color.LIGHT_RED);
#Store Previous Data
def zzsave1 = if !IsNaN(zzSave) then zzSave else zzsave1[1];
def zzsave2 = zzsave1;
rec priorzz1 = if zzsave2 != zzsave2[1] then zzsave2[1] else priorzz1[1];
rec priorzz2 = if priorzz1 != priorzz1[1] then priorzz1[1] else priorzz2[1];
rec priorzz3 = if priorzz2 != priorzz2[1] then priorzz2[1] else priorzz3[1];
#Fibonacci Extensions
rec data = CompoundValue(1, if (zzSave == high or zzSave == low) then data[1] + 1 else data[1], 0);
def datacount = (HighestAll(data) - data[1]);
input numberextfibstoshow = 2;
rec cpo = if dir[1] != dir then 0 else 1;
input showFibExtLines = yes;
input showtodayonly = no;
def today = if showtodayonly == yes then GetDay() == GetLastDay() else GetDay();
def extfib1 = if zzSave == high then high - AbsValue(priorzz2 - priorzz1) * 1
else extfib1[1];
plot extfib100 = if datacount <= numberextfibstoshow and today and showFibExtLines and !IsNaN(extfib1) and dir < 0 and cpo != 0 then extfib1[1] else Double.NaN;
extfib100.SetPaintingStrategy(PaintingStrategy.DASHES);
extfib100.SetDefaultColor(Color.RED);
extfib100.SetLineWeight(1);
extfib100.HideBubble();
def extfib1a = if zzSave == high then high - AbsValue(priorzz2 - priorzz1) * 0.382
else extfib1a[1];
plot extfib382 = if datacount <= numberextfibstoshow and today and showFibExtLines and !IsNaN(extfib1a) and dir < 0 and cpo != 0 then extfib1a[1] else Double.NaN;
extfib382.SetPaintingStrategy(PaintingStrategy.DASHES);
extfib382.SetDefaultColor(Color.RED);
extfib382.SetLineWeight(1);
extfib382.HideBubble();
def extfib2 = if zzSave == high then high - AbsValue(priorzz2 - priorzz1) *
0.618 else extfib2[1];
plot extfib618 = if datacount <= numberextfibstoshow and today and showFibExtLines and !IsNaN(extfib2) and dir < 0 and cpo != 0 then extfib2[1] else Double.NaN;
extfib618.SetPaintingStrategy(PaintingStrategy.DASHES);
extfib618.SetDefaultColor(Color.RED);
extfib618.SetLineWeight(1);
extfib618.HideBubble();
def extfib3 = if zzSave == high then high - AbsValue(priorzz2 - priorzz1) *
1.618 else extfib3[1];
plot extfib1618 = if datacount <= numberextfibstoshow and today and showFibExtLines and !IsNaN(extfib3) and dir < 0 and cpo != 0 then extfib3[1] else Double.NaN;
extfib1618.SetPaintingStrategy(PaintingStrategy.DASHES);
extfib1618.SetDefaultColor(Color.RED);
extfib1618.SetLineWeight(1);
extfib1618.HideBubble();
def extfib3a = if zzSave == high then high - AbsValue(priorzz2 - priorzz1) *
2.000 else extfib3a[1];
plot extfib2000 = if datacount <= numberextfibstoshow and today and showFibExtLines and !IsNaN(extfib3a) and dir < 0 and cpo != 0 then extfib3a[1] else Double.NaN;
extfib2000.SetPaintingStrategy(PaintingStrategy.DASHES);
extfib2000.SetDefaultColor(Color.RED);
extfib2000.SetLineWeight(1);
extfib2000.HideBubble();
def extfib4 = if zzSave == high then high - AbsValue(priorzz2 - priorzz1) *
2.618 else extfib4[1];
plot extfib2618 = if datacount <= numberextfibstoshow and today and showFibExtLines and !IsNaN(extfib4) and dir < 0 and cpo != 0 then extfib4[1] else Double.NaN;
extfib2618.SetPaintingStrategy(PaintingStrategy.DASHES);
extfib2618.SetDefaultColor(Color.RED);
extfib2618.SetLineWeight(1);
extfib2618.HideBubble();
def extfib5 = if zzSave == high then high - AbsValue(priorzz2 - priorzz1) *
3.618 else extfib5[1];
plot extfib3618 = if datacount <= numberextfibstoshow and today and showFibExtLines and !IsNaN(extfib5) and dir < 0 and cpo != 0 then extfib5[1] else Double.NaN;
extfib3618.SetPaintingStrategy(PaintingStrategy.DASHES);
extfib3618.SetDefaultColor(Color.RED);
extfib3618.SetLineWeight(1);
extfib3618.HideBubble();
def extfib1_ = if zzSave == low then low + AbsValue(priorzz2 - priorzz1) * 1
else extfib1_[1];
plot extfib100_ = if datacount <= numberextfibstoshow and today and showFibExtLines and !IsNaN(extfib1_) and dir > 0 and cpo != 0 then extfib1_[1] else Double.NaN;
extfib100_.SetPaintingStrategy(PaintingStrategy.DASHES);
extfib100_.SetDefaultColor(Color.GREEN);
extfib100_.SetLineWeight(1);
extfib100_.HideBubble();
def extfib1a_ = if zzSave == low then low + AbsValue(priorzz2 - priorzz1) * 0.382
else extfib1a_[1];
plot extfib382_ = if datacount <= numberextfibstoshow and today and showFibExtLines and !IsNaN(extfib1a_) and dir > 0 and cpo != 0 then extfib1a_[1] else Double.NaN;
extfib382_.SetPaintingStrategy(PaintingStrategy.DASHES);
extfib382_.SetDefaultColor(Color.GREEN);
extfib382_.SetLineWeight(1);
extfib382_.HideBubble();
def extfib2_ = if zzSave == low then low + AbsValue(priorzz2 - priorzz1) *
0.618 else extfib2_[1];
plot extfib618_ = if datacount <= numberextfibstoshow and today and showFibExtLines and !IsNaN(extfib2_) and dir > 0 and cpo != 0 then extfib2_[1] else Double.NaN;
extfib618_.SetPaintingStrategy(PaintingStrategy.DASHES);
extfib618_.SetDefaultColor(Color.GREEN);
extfib618_.SetLineWeight(1);
extfib618_.HideBubble();
def extfib3_ = if zzSave == low then low + AbsValue(priorzz2 - priorzz1) *
1.618 else extfib3_[1];
plot extfib1618_ = if datacount <= numberextfibstoshow and today and showFibExtLines and !IsNaN(extfib3_) and dir > 0 and cpo != 0 then extfib3_[1] else Double.NaN;
extfib1618_.SetPaintingStrategy(PaintingStrategy.DASHES);
extfib1618_.SetDefaultColor(Color.GREEN);
extfib1618_.SetLineWeight(1);
extfib1618_.HideBubble();
def extfib3a_ = if zzSave == low then low + AbsValue(priorzz2 - priorzz1) *
2.000 else extfib3a_[1];
plot extfib2000_ = if datacount <= numberextfibstoshow and today and showFibExtLines and !IsNaN(extfib3a_) and dir > 0 and cpo != 0 then extfib3a_[1] else Double.NaN;
extfib2000_.SetPaintingStrategy(PaintingStrategy.DASHES);
extfib2000_.SetDefaultColor(Color.GREEN);
extfib2000_.SetLineWeight(1);
extfib2000_.HideBubble();
def extfib4_ = if zzSave == low then low + AbsValue(priorzz2 - priorzz1) *
2.618 else extfib4_[1];
plot extfib2618_ = if datacount <= numberextfibstoshow and today and showFibExtLines and !IsNaN(extfib4_) and dir > 0 and cpo != 0 then extfib4_[1] else Double.NaN;
extfib2618_.SetPaintingStrategy(PaintingStrategy.DASHES);
extfib2618_.SetDefaultColor(Color.GREEN);
extfib2618_.SetLineWeight(1);
extfib2618_.HideBubble();
def extfib5_ = if zzSave == low then low + AbsValue(priorzz2 - priorzz1) *
3.618 else extfib5_[1];
plot extfib3618_ = if datacount <= numberextfibstoshow and today and showFibExtLines and !IsNaN(extfib5_) and dir > 0 and cpo != 0 then extfib5_[1] else Double.NaN;
extfib3618_.SetPaintingStrategy(PaintingStrategy.DASHES);
extfib3618_.SetDefaultColor(Color.GREEN);
extfib3618_.SetLineWeight(1);
extfib3618_.HideBubble();
input fibextbubblespacesinexpansion = 8;
def b = fibextbubblespacesinexpansion;
def direction = if !isUp then 1 else 0;
AddChartBubble( direction[b + 1] == 1 and showFibExtLines and !IsNaN(close[b + 1]) and IsNaN(close), extfib1[b + 2], "100%", Color.RED, no);
AddChartBubble( direction[b + 1] == 1 and showFibExtLines and !IsNaN(close[b + 1]) and IsNaN(close), extfib1a[b + 2], "38.2%", Color.RED, no);
AddChartBubble( direction[b + 1] == 1 and showFibExtLines and !IsNaN(close[b + 1]) and IsNaN(close), extfib2[b + 2], "61.8%", Color.RED, no);
AddChartBubble( direction[b + 1] == 1 and showFibExtLines and !IsNaN(close[b + 1]) and IsNaN(close), extfib3[b + 2], "161.8%", Color.RED, no);
AddChartBubble( direction[b + 1] == 1 and showFibExtLines and !IsNaN(close[b + 1]) and IsNaN(close), extfib3a[b + 2], "200%", Color.RED, no);
AddChartBubble( direction[b + 1] == 1 and showFibExtLines and !IsNaN(close[b + 1]) and IsNaN(close), extfib4[b + 2], "261.8%", Color.RED, no);
AddChartBubble( direction[b + 1] == 1 and showFibExtLines and !IsNaN(close[b + 1]) and IsNaN(close), extfib5[b + 2], "361.8%", Color.RED, no);
AddChartBubble( direction[b + 1] == 0 and showFibExtLines and !IsNaN(close[b + 1]) and IsNaN(close), extfib1_[b + 2], "100%", Color.GREEN, yes);
AddChartBubble( direction[b + 1] == 0 and showFibExtLines and !IsNaN(close[b + 1]) and IsNaN(close), extfib1a_[b + 2], "38.2%", Color.GREEN, yes);
AddChartBubble( direction[b + 1] == 0 and showFibExtLines and !IsNaN(close[b + 1]) and IsNaN(close), extfib2_[b + 2], "61.8%", Color.GREEN, yes);
AddChartBubble( direction[b + 1] == 0 and showFibExtLines and !IsNaN(close[b + 1]) and IsNaN(close), extfib3_[b + 2], "161.8%", Color.GREEN, yes);
AddChartBubble( direction[b + 1] == 0 and showFibExtLines and !IsNaN(close[b + 1]) and IsNaN(close), extfib3a_[b + 2], "200%", Color.GREEN, yes);
AddChartBubble( direction[b + 1] == 0 and showFibExtLines and !IsNaN(close[b + 1]) and IsNaN(close), extfib4_[b + 2], "261.8%", Color.GREEN, yes);
AddChartBubble( direction[b + 1] == 0 and showFibExtLines and !IsNaN(close[b + 1]) and IsNaN(close), extfib5_[b + 2], "361.8%", Color.GREEN, yes);
#Volume at Reversals
def vol = if BarNumber() == 0 then 0 else volume + vol[1];
def vol1 = if BarNumber() == 1 then volume else vol1[1];
def xxvol = if zzSave == high or zzSave == low then TotalSum(volume) else xxvol[1];
def chgvol = if xxvol - xxvol[1] + vol1 == vol then vol else xxvol - xxvol[1];
input showBubblesVolume = no;
AddChartBubble(showBubblesVolume and !IsNaN(zz) and BarNumber() != 1, if isUp then high * (1 + bubbleoffset) else low * (1 - bubbleoffset), chgvol,if isUp and chghigh > 0 then Color.GREEN else if isUp and chghigh < 0 then Color.RED else if isUp then Color.YELLOW else if !isUp and chglow > 0 then Color.GREEN else if !isUp and chglow < 0 then Color.RED else Color.YELLOW, if isUp then yes else no );
Hello everyone,
I love this custom script (ZigZag High Low with Supply DemandIndex and Fibs_Linus_Lar), and find the arrows very useful. I would like to have a watchlist widget that shows when the arrow up/down occurs, but can't seem to figure out how to make one. Please help!
Code:
# Archive Name: ZigZag High Low with Supply DemandIndex and Fibs_Linus_Lar
# Archive Section: Scripts
# Suggested Tos Name: ZigZagHighLow_SupplyDemand_FibExtensions_LinusLar
# Archive Date:
# Archive Notes:
#TOS version ZigZagHighLow modified in part by Linus' and Lar's code
input bubbleoffset = .0005;
input percentamount = .01;
input revAmount = .15;
input atrreversal = 1.0;
input atrlength = 5;
def zz = ZigZagHighLow("price h" = high, "price l" = low, "percentage reversal" = percentAmount, "absolute reversal" = revAmount, "atr length" =atrlength, "atr reversal" = atrreversal);
def reversalAmount = if (close * percentamount / 100) > Max(revAmount < atrreversal * atrlength, revAmount) then (close * percentamount / 100) else if revAmount < atrreversal * atrlength then atrreversal * atrlength else revAmount;
rec zzSave = if !IsNaN(zz) then zz else GetValue(zzSave, 1);
def chg = (if zzSave == high then high else low) - GetValue(zzSave, 1);
def isUp = chg >= 0;
rec isConf = AbsValue(chg) >= reversalAmount or (IsNaN(GetValue(zz, 1)) and GetValue(isConf, 1));
def zzd = if isUp then 1 else 0;
plot zzp = if zzd <= 1 then zz else Double.NaN;
zzp.AssignValueColor(if zzd == 1 then Color.GREEN else if zzd == 0 then Color.RED else Color.DARK_ORANGE);
zzp.SetStyle(Curve.FIRM);
zzp.EnableApproximation();
#Price Change between zigzags
def xxhigh = if zzSave == high then high else xxhigh[1];
def chghigh = high - xxhigh[1];
def xxlow = if zzSave == low then low else xxlow[1];
def chglow = low - xxlow[1];
input showBubbleschange = yes;
AddChartBubble(showBubbleschange and !IsNaN(zz) and BarNumber() != 1, if isUp then high * (1 + bubbleoffset) else low * (1 - bubbleoffset) , "$" + chg , if isUp and chghigh > 0 then Color.GREEN else if isUp and chghigh < 0 then Color.RED else if isUp then Color.YELLOW else if !isUp and chglow > 0 then Color.GREEN else if !isUp and chglow < 0 then Color.RED else Color.YELLOW, isUp);
#Price at High/Low
input showBubblesprice = no;
AddChartBubble(showBubblesprice and !IsNaN(zz) and BarNumber() != 1, if isUp then high * (1 + bubbleoffset) else low * (1 - bubbleoffset) , if isUp then "$" + high else "$" + low , if isUp and chghigh > 0 then Color.GREEN else if isUp and chghigh < 0 then Color.RED else if isUp then Color.YELLOW else if !isUp and chglow > 0 then Color.GREEN else if !isUp and chglow < 0 then Color.RED else Color.YELLOW, isUp);
#Label for Confirmed/Unconfirmed Status of Current Zigzag
AddLabel(BarNumber() != 1, (if isConf then "Confirmed " else "Unconfirmed ") + "ZigZag: " + chg, if !isConf then Color.DARK_ORANGE else if isUp then Color.GREEN else Color.RED);
#Bar Count between zigzags
rec zzcount = if zzSave[1] != zzSave then 1 else if zzSave[1] == zzSave then zzcount[1] + 1 else 0;
def zzcounthilo = if zzcounthilo[1] == 0 and (zzSave == high or zzSave == low) then 1 else if zzSave == high or zzSave == low then zzcounthilo[1] + 1 else zzcounthilo[1];
def zzhilo = if zzSave == high or zzSave == low then zzcounthilo else zzcounthilo + 1;
def zzcounthigh = if zzSave == high then zzcount[1] else Double.NaN;
def zzcountlow = if zzSave == low then zzcount[1] else Double.NaN;
input showBubblesbarcount = no;
AddChartBubble(showBubblesbarcount and !IsNaN(zz) and BarNumber() != 1, if isUp then high * (1 + bubbleoffset) else low * (1 - bubbleoffset) , if zzSave == high then zzcounthigh else zzcountlow, if isUp and chghigh > 0 then Color.GREEN else if isUp and chghigh < 0 then Color.RED else if isUp then Color.YELLOW else if !isUp and chglow > 0 then Color.GREEN else if !isUp and chglow < 0 then Color.RED else Color.YELLOW, if isUp then yes else no );
#Arrows
def zzL = if !IsNaN(zz) and !isUp then low else GetValue(zzL, 1);
def zzH = if !IsNaN(zz) and isUp then high else GetValue(zzH, 1);
def dir = CompoundValue(1, if zzL != zzL[1] or low==zzl[1] and low==zzsave then 1 else if zzH != zzH[1] or high==zzh[1] and high==zzsave then -1 else dir[1], 0);
def signal = CompoundValue(1, if dir > 0 and low > zzL then if signal[1] <= 0 then 1 else signal[1] else if dir < 0 and high < zzH then if signal[1] >= 0 then -1 else signal[1] else signal[1], 0);
input showarrows = no;
plot U1 = showarrows and signal > 0 and signal[1] <= 0;
U1.SetPaintingStrategy(PaintingStrategy.BOOLEAN_ARROW_UP);
U1.SetDefaultColor(Color.GREEN);
U1.SetLineWeight(4);
plot D1 = showarrows and signal < 0 and signal[1] >= 0;
D1.SetPaintingStrategy(PaintingStrategy.BOOLEAN_ARROW_DOWN);
D1.SetDefaultColor(Color.RED);
D1.SetLineWeight(4);
#Alerts
input usealerts = no;
Alert(usealerts and U1, "ZIG-UP", Alert.BAR, Sound.Bell);
Alert(usealerts and D1, "ZAG-DOWN", Alert.BAR, Sound.Chimes);
#Supply Demand Areas
rec data1 = CompoundValue(1, if (zzSave == high or zzSave == low) then data1[1] + 1 else data1[1], 0);
def datacount1 = (HighestAll(data1) - data1[1]);
input numbersuppdemandtoshow = 2;
input showSupplyDemand = {default Pivot, Arrow, None};
def idx = if showSupplyDemand == showSupplyDemand.Pivot then 1 else 0;
def rLow;
def rHigh;
if signal crosses 0 {
rLow = low[idx];
rHigh = high[idx];
} else {
rLow = rLow[1];
rHigh = rHigh[1];
}
plot HighLine = if datacount1 <= numbersuppdemandtoshow and showSupplyDemand != showSupplyDemand.None and !isNaN(close) and rHigh != 0 then rHigh else Double.NaN;
HighLine.SetPaintingStrategy(PaintingStrategy.HORIZONTAL);
HighLine.AssignValueColor(if signal > 0 then Color.GREEN else Color.RED);
plot LowLine = if datacount1 <= numbersuppdemandtoshow and showSupplyDemand != showSupplyDemand.None and !isNaN(close) and rLow != 0 then rLow else Double.NaN;
LowLine.SetPaintingStrategy(PaintingStrategy.HORIZONTAL);
LowLine.AssignValueColor(if signal > 0 then Color.GREEN else Color.RED);
def hlUp = if signal > 0 then HighLine else Double.NaN;
def hlDn = if signal < 0 then HighLine else Double.NaN;
input showsupplydemandcloud = yes;
AddCloud(if showsupplydemandcloud then hlUp else double.nan, LowLine, Color.LIGHT_GREEN, Color.LIGHT_GREEN);
AddCloud(if showsupplydemandcloud then hlDn else double.nan, LowLine, Color.LIGHT_RED, Color.LIGHT_RED);
#Store Previous Data
def zzsave1 = if !IsNaN(zzSave) then zzSave else zzsave1[1];
def zzsave2 = zzsave1;
rec priorzz1 = if zzsave2 != zzsave2[1] then zzsave2[1] else priorzz1[1];
rec priorzz2 = if priorzz1 != priorzz1[1] then priorzz1[1] else priorzz2[1];
rec priorzz3 = if priorzz2 != priorzz2[1] then priorzz2[1] else priorzz3[1];
#Fibonacci Extensions
rec data = CompoundValue(1, if (zzSave == high or zzSave == low) then data[1] + 1 else data[1], 0);
def datacount = (HighestAll(data) - data[1]);
input numberextfibstoshow = 2;
rec cpo = if dir[1] != dir then 0 else 1;
input showFibExtLines = yes;
input showtodayonly = no;
def today = if showtodayonly == yes then GetDay() == GetLastDay() else GetDay();
def extfib1 = if zzSave == high then high - AbsValue(priorzz2 - priorzz1) * 1
else extfib1[1];
plot extfib100 = if datacount <= numberextfibstoshow and today and showFibExtLines and !IsNaN(extfib1) and dir < 0 and cpo != 0 then extfib1[1] else Double.NaN;
extfib100.SetPaintingStrategy(PaintingStrategy.DASHES);
extfib100.SetDefaultColor(Color.RED);
extfib100.SetLineWeight(1);
extfib100.HideBubble();
def extfib1a = if zzSave == high then high - AbsValue(priorzz2 - priorzz1) * 0.382
else extfib1a[1];
plot extfib382 = if datacount <= numberextfibstoshow and today and showFibExtLines and !IsNaN(extfib1a) and dir < 0 and cpo != 0 then extfib1a[1] else Double.NaN;
extfib382.SetPaintingStrategy(PaintingStrategy.DASHES);
extfib382.SetDefaultColor(Color.RED);
extfib382.SetLineWeight(1);
extfib382.HideBubble();
def extfib2 = if zzSave == high then high - AbsValue(priorzz2 - priorzz1) *
0.618 else extfib2[1];
plot extfib618 = if datacount <= numberextfibstoshow and today and showFibExtLines and !IsNaN(extfib2) and dir < 0 and cpo != 0 then extfib2[1] else Double.NaN;
extfib618.SetPaintingStrategy(PaintingStrategy.DASHES);
extfib618.SetDefaultColor(Color.RED);
extfib618.SetLineWeight(1);
extfib618.HideBubble();
def extfib3 = if zzSave == high then high - AbsValue(priorzz2 - priorzz1) *
1.618 else extfib3[1];
plot extfib1618 = if datacount <= numberextfibstoshow and today and showFibExtLines and !IsNaN(extfib3) and dir < 0 and cpo != 0 then extfib3[1] else Double.NaN;
extfib1618.SetPaintingStrategy(PaintingStrategy.DASHES);
extfib1618.SetDefaultColor(Color.RED);
extfib1618.SetLineWeight(1);
extfib1618.HideBubble();
def extfib3a = if zzSave == high then high - AbsValue(priorzz2 - priorzz1) *
2.000 else extfib3a[1];
plot extfib2000 = if datacount <= numberextfibstoshow and today and showFibExtLines and !IsNaN(extfib3a) and dir < 0 and cpo != 0 then extfib3a[1] else Double.NaN;
extfib2000.SetPaintingStrategy(PaintingStrategy.DASHES);
extfib2000.SetDefaultColor(Color.RED);
extfib2000.SetLineWeight(1);
extfib2000.HideBubble();
def extfib4 = if zzSave == high then high - AbsValue(priorzz2 - priorzz1) *
2.618 else extfib4[1];
plot extfib2618 = if datacount <= numberextfibstoshow and today and showFibExtLines and !IsNaN(extfib4) and dir < 0 and cpo != 0 then extfib4[1] else Double.NaN;
extfib2618.SetPaintingStrategy(PaintingStrategy.DASHES);
extfib2618.SetDefaultColor(Color.RED);
extfib2618.SetLineWeight(1);
extfib2618.HideBubble();
def extfib5 = if zzSave == high then high - AbsValue(priorzz2 - priorzz1) *
3.618 else extfib5[1];
plot extfib3618 = if datacount <= numberextfibstoshow and today and showFibExtLines and !IsNaN(extfib5) and dir < 0 and cpo != 0 then extfib5[1] else Double.NaN;
extfib3618.SetPaintingStrategy(PaintingStrategy.DASHES);
extfib3618.SetDefaultColor(Color.RED);
extfib3618.SetLineWeight(1);
extfib3618.HideBubble();
def extfib1_ = if zzSave == low then low + AbsValue(priorzz2 - priorzz1) * 1
else extfib1_[1];
plot extfib100_ = if datacount <= numberextfibstoshow and today and showFibExtLines and !IsNaN(extfib1_) and dir > 0 and cpo != 0 then extfib1_[1] else Double.NaN;
extfib100_.SetPaintingStrategy(PaintingStrategy.DASHES);
extfib100_.SetDefaultColor(Color.GREEN);
extfib100_.SetLineWeight(1);
extfib100_.HideBubble();
def extfib1a_ = if zzSave == low then low + AbsValue(priorzz2 - priorzz1) * 0.382
else extfib1a_[1];
plot extfib382_ = if datacount <= numberextfibstoshow and today and showFibExtLines and !IsNaN(extfib1a_) and dir > 0 and cpo != 0 then extfib1a_[1] else Double.NaN;
extfib382_.SetPaintingStrategy(PaintingStrategy.DASHES);
extfib382_.SetDefaultColor(Color.GREEN);
extfib382_.SetLineWeight(1);
extfib382_.HideBubble();
def extfib2_ = if zzSave == low then low + AbsValue(priorzz2 - priorzz1) *
0.618 else extfib2_[1];
plot extfib618_ = if datacount <= numberextfibstoshow and today and showFibExtLines and !IsNaN(extfib2_) and dir > 0 and cpo != 0 then extfib2_[1] else Double.NaN;
extfib618_.SetPaintingStrategy(PaintingStrategy.DASHES);
extfib618_.SetDefaultColor(Color.GREEN);
extfib618_.SetLineWeight(1);
extfib618_.HideBubble();
def extfib3_ = if zzSave == low then low + AbsValue(priorzz2 - priorzz1) *
1.618 else extfib3_[1];
plot extfib1618_ = if datacount <= numberextfibstoshow and today and showFibExtLines and !IsNaN(extfib3_) and dir > 0 and cpo != 0 then extfib3_[1] else Double.NaN;
extfib1618_.SetPaintingStrategy(PaintingStrategy.DASHES);
extfib1618_.SetDefaultColor(Color.GREEN);
extfib1618_.SetLineWeight(1);
extfib1618_.HideBubble();
def extfib3a_ = if zzSave == low then low + AbsValue(priorzz2 - priorzz1) *
2.000 else extfib3a_[1];
plot extfib2000_ = if datacount <= numberextfibstoshow and today and showFibExtLines and !IsNaN(extfib3a_) and dir > 0 and cpo != 0 then extfib3a_[1] else Double.NaN;
extfib2000_.SetPaintingStrategy(PaintingStrategy.DASHES);
extfib2000_.SetDefaultColor(Color.GREEN);
extfib2000_.SetLineWeight(1);
extfib2000_.HideBubble();
def extfib4_ = if zzSave == low then low + AbsValue(priorzz2 - priorzz1) *
2.618 else extfib4_[1];
plot extfib2618_ = if datacount <= numberextfibstoshow and today and showFibExtLines and !IsNaN(extfib4_) and dir > 0 and cpo != 0 then extfib4_[1] else Double.NaN;
extfib2618_.SetPaintingStrategy(PaintingStrategy.DASHES);
extfib2618_.SetDefaultColor(Color.GREEN);
extfib2618_.SetLineWeight(1);
extfib2618_.HideBubble();
def extfib5_ = if zzSave == low then low + AbsValue(priorzz2 - priorzz1) *
3.618 else extfib5_[1];
plot extfib3618_ = if datacount <= numberextfibstoshow and today and showFibExtLines and !IsNaN(extfib5_) and dir > 0 and cpo != 0 then extfib5_[1] else Double.NaN;
extfib3618_.SetPaintingStrategy(PaintingStrategy.DASHES);
extfib3618_.SetDefaultColor(Color.GREEN);
extfib3618_.SetLineWeight(1);
extfib3618_.HideBubble();
input fibextbubblespacesinexpansion = 8;
def b = fibextbubblespacesinexpansion;
def direction = if !isUp then 1 else 0;
AddChartBubble( direction[b + 1] == 1 and showFibExtLines and !IsNaN(close[b + 1]) and IsNaN(close), extfib1[b + 2], "100%", Color.RED, no);
AddChartBubble( direction[b + 1] == 1 and showFibExtLines and !IsNaN(close[b + 1]) and IsNaN(close), extfib1a[b + 2], "38.2%", Color.RED, no);
AddChartBubble( direction[b + 1] == 1 and showFibExtLines and !IsNaN(close[b + 1]) and IsNaN(close), extfib2[b + 2], "61.8%", Color.RED, no);
AddChartBubble( direction[b + 1] == 1 and showFibExtLines and !IsNaN(close[b + 1]) and IsNaN(close), extfib3[b + 2], "161.8%", Color.RED, no);
AddChartBubble( direction[b + 1] == 1 and showFibExtLines and !IsNaN(close[b + 1]) and IsNaN(close), extfib3a[b + 2], "200%", Color.RED, no);
AddChartBubble( direction[b + 1] == 1 and showFibExtLines and !IsNaN(close[b + 1]) and IsNaN(close), extfib4[b + 2], "261.8%", Color.RED, no);
AddChartBubble( direction[b + 1] == 1 and showFibExtLines and !IsNaN(close[b + 1]) and IsNaN(close), extfib5[b + 2], "361.8%", Color.RED, no);
AddChartBubble( direction[b + 1] == 0 and showFibExtLines and !IsNaN(close[b + 1]) and IsNaN(close), extfib1_[b + 2], "100%", Color.GREEN, yes);
AddChartBubble( direction[b + 1] == 0 and showFibExtLines and !IsNaN(close[b + 1]) and IsNaN(close), extfib1a_[b + 2], "38.2%", Color.GREEN, yes);
AddChartBubble( direction[b + 1] == 0 and showFibExtLines and !IsNaN(close[b + 1]) and IsNaN(close), extfib2_[b + 2], "61.8%", Color.GREEN, yes);
AddChartBubble( direction[b + 1] == 0 and showFibExtLines and !IsNaN(close[b + 1]) and IsNaN(close), extfib3_[b + 2], "161.8%", Color.GREEN, yes);
AddChartBubble( direction[b + 1] == 0 and showFibExtLines and !IsNaN(close[b + 1]) and IsNaN(close), extfib3a_[b + 2], "200%", Color.GREEN, yes);
AddChartBubble( direction[b + 1] == 0 and showFibExtLines and !IsNaN(close[b + 1]) and IsNaN(close), extfib4_[b + 2], "261.8%", Color.GREEN, yes);
AddChartBubble( direction[b + 1] == 0 and showFibExtLines and !IsNaN(close[b + 1]) and IsNaN(close), extfib5_[b + 2], "361.8%", Color.GREEN, yes);
#Volume at Reversals
def vol = if BarNumber() == 0 then 0 else volume + vol[1];
def vol1 = if BarNumber() == 1 then volume else vol1[1];
def xxvol = if zzSave == high or zzSave == low then TotalSum(volume) else xxvol[1];
def chgvol = if xxvol - xxvol[1] + vol1 == vol then vol else xxvol - xxvol[1];
input showBubblesVolume = no;
AddChartBubble(showBubblesVolume and !IsNaN(zz) and BarNumber() != 1, if isUp then high * (1 + bubbleoffset) else low * (1 - bubbleoffset), chgvol,if isUp and chghigh > 0 then Color.GREEN else if isUp and chghigh < 0 then Color.RED else if isUp then Color.YELLOW else if !isUp and chglow > 0 then Color.GREEN else if !isUp and chglow < 0 then Color.RED else Color.YELLOW, if isUp then yes else no );
I trimmed the script down to just plot the number of bars from the last pivot. A red color should indicate that the last pivot was at the high and green otherwise. This is different coloring than the code above so that the watchlist will hopefully give you the correct direction.
As with all pivot scripts, the pivot is dependent on future bars. The zigzag is a little different in that it will restore the prior direction if the new pivot is not established. So you will see the bar count change to 1 (or higher along with a color change) and then revert back to the prior color and continued count. Be careful.
Place the following code in a watchlist.
Ruby:#TOS version ZigZagHighLow modified in part by Linus' and Lar's code input bubbleoffset = .0005; input percentamount = .01; input revAmount = .15; input atrreversal = 1.0; input atrlength = 5; def zz = ZigZagHighLow("price h" = high, "price l" = low, "percentage reversal" = percentAmount, "absolute reversal" = revAmount, "atr length" =atrlength, "atr reversal" = atrreversal); def reversalAmount = if (close * percentamount / 100) > Max(revAmount < atrreversal * atrlength, revAmount) then (close * percentamount / 100) else if revAmount < atrreversal * atrlength then atrreversal * atrlength else revAmount; rec zzSave = if !IsNaN(zz) then zz else GetValue(zzSave, 1); def chg = (if zzSave == high then high else low) - GetValue(zzSave, 1); def isUp = chg >= 0; rec isConf = AbsValue(chg) >= reversalAmount or (IsNaN(GetValue(zz, 1)) and GetValue(isConf, 1)); def zzd = if isUp then 1 else 0; plot zzp = if zzd <= 1 then zz else Double.NaN; zzp.AssignValueColor(if zzd == 1 then Color.GREEN else if zzd == 0 then Color.RED else Color.DARK_ORANGE); zzp.SetStyle(Curve.FIRM); zzp.EnableApproximation(); #Price Change between zigzags def xxhigh = if zzSave == high then high else xxhigh[1]; def chghigh = high - xxhigh[1]; def xxlow = if zzSave == low then low else xxlow[1]; def chglow = low - xxlow[1]; #Bar Count between zigzags rec zzcount = if zzSave[1] != zzSave then 1 else if zzSave[1] == zzSave then zzcount[1] + 1 else 0; def zzcounthilo = if zzcounthilo[1] == 0 and (zzSave == high or zzSave == low) then 1 else if zzSave == high or zzSave == low then zzcounthilo[1] + 1 else zzcounthilo[1]; def zzhilo = if zzSave == high or zzSave == low then zzcounthilo else zzcounthilo + 1; def zzcounthigh = if zzSave == high then zzcount[1] else Double.NaN; def zzcountlow = if zzSave == low then zzcount[1] else Double.NaN; input showBubblesbarcount = no; AddChartBubble(showBubblesbarcount and !IsNaN(zz) and BarNumber() != 1, if isUp then high * (1 + bubbleoffset) else low * (1 - bubbleoffset) , if zzSave == high then zzcounthigh else zzcountlow, if isUp and chghigh > 0 then Color.GREEN else if isUp and chghigh < 0 then Color.RED else if isUp then Color.YELLOW else if !isUp and chglow > 0 then Color.GREEN else if !isUp and chglow < 0 then Color.RED else Color.YELLOW, if isUp then yes else no ); addlabel(1, if zzSave == high then zzcounthigh else zzcountlow, if !isUp then color.red else color.green);
Hi, I am trying to use ZigZag High Low strategy for my BUY alert. The alert worked ok in back testing, but the alert did not trigger in live mode. (probably because the script is too complex). Can we simplify the ZigZag high low script, so I can use as an alert in Live mode (5 min. chart)?. Thanks.@lazeelink I had actually worked with this code several years ago when ZZZ/Lar first posted it to the ThinkScript lounge. It looked like a solid piece of code with lots of bells and whistles. Being intrigued I sectionalized the study, and rearranged the flow of some of the ZZ Logic in order to digest it better.
Since you do not wish to see any of the fib indications, the following version had all the fib related code taken out. Not sure what your intention is but you could very easily have set the user input showFibExtLines to "no" and the fib lines will not be plotted. At any rate, here's the study I worked on last night following your request complete with change log. Have fun!
Code:# ZigZag High Low Supply Demand # ZigZag High Low modified in part by Linus' and Lar's code # ZZZ, with modifications by tomsk # 1.12.2020 # https://usethinkscript.com/threads/zigzag-high-low-with-supply-demand-zones-for-thinkorswim.172/page-2#post-13790 # V1.0 - 10.09.2016 - ZZZ - Initial release of ZigZag High Low Supply Demand # V1.1 - 06.28.2017 - tomsk - Sectionalized code, and rearranged flow of some ZZ Logic # V1.2 - 01.12.2020 - tomsk - Removed Fibonacci related code per user request input showBubblesChange = yes; # Price Change between Zigzags input showBubblesPrice = no; # Price at Zigzag High/Low input showBubblesBarCount = no; # Bar Count between Zigzags input showBubblesVolume = no; # Volume at Zigzag Reversals input showArrows = no; input useAlerts = no; input numberSuppDemandToShow = 2; input showSupplyDemand = {default Pivot, Arrow, None}; input showSupplyDemandCloud = yes; input BubbleOffset = .0005; input PercentAmount = .01; input RevAmount = .15; input ATRreversal = 1.0; input ATRlength = 5; def zz = ZigZagHighLow("price h" = high, "price l" = low, "percentage reversal" = PercentAmount, "absolute reversal" = RevAmount, "atr length" = ATRlength, "atr reversal" = ATRreversal); def ReversalAmount = if (close * PercentAmount / 100) > Max(RevAmount < ATRreversal * ATRlength, RevAmount) then (close * PercentAmount / 100) else if RevAmount < ATRreversal * ATRlength then ATRreversal * ATRlength else RevAmount; # Zig Zag Specific Data def zzSave = if !IsNaN(zz) then zz else GetValue(zzSave, 1); def chg = (if zzSave == high then high else low) - GetValue(zzSave, 1); def isUp = chg >= 0; def isConf = AbsValue(chg) >= ReversalAmount or (IsNaN(GetValue(zz, 1)) and GetValue(isConf, 1)); # Price Change Between ZigZags def xxHigh = if zzSave == high then high else xxHigh[1]; def chgHigh = high - xxHigh[1]; def xxLow = if zzSave == low then low else xxLow[1]; def chgLow = low - xxLow[1]; # Bar Count Between ZigZags def zzCount = if zzSave[1] != zzSave then 1 else if zzSave[1] == zzSave then zzCount[1] + 1 else 0; def zzCountHiLo = if zzCountHiLo[1] == 0 and (zzSave == high or zzSave == low) then 1 else if zzSave == high or zzSave == low then zzCountHiLo[1] + 1 else zzCountHiLo[1]; def zzHiLo = if zzSave == high or zzSave == low then zzCountHiLo else zzCountHiLo + 1; def zzCountHigh = if zzSave == high then zzCount[1] else Double.NaN; def zzCountLow = if zzSave == low then zzCount[1] else Double.NaN; # Volume at Reversals def vol = if BarNumber() == 0 then 0 else volume + vol[1]; def vol1 = if BarNumber() == 1 then volume else vol1[1]; def xxVol = if zzSave == high or zzSave == low then TotalSum(volume) else xxVol[1]; def chgVol = if xxVol - xxVol[1] + vol1 == vol then vol else xxVol - xxVol[1]; # Label for Confirmed/Unconfirmed Status of Current Zigzag AddLabel(BarNumber() != 1, (if isConf then "Confirmed " else "Unconfirmed ") + "ZigZag: " + chg, if !isConf then Color.Dark_Orange else if isUp then Color.Green else Color.Red); # Zig Zag Plot plot zzp = if isUp <= 1 then zz else Double.NaN; zzp.AssignValueColor(if isUp then Color.Green else if !isUp then Color.Red else Color.Dark_Orange); zzp.SetStyle(Curve.FIRM); zzp.EnableApproximation(); # Bubbles # Price Change between Zigzags AddChartBubble(showBubblesChange and !IsNaN(zz) and BarNumber() != 1, if isUp then high * (1 + BubbleOffset) else low * (1 - BubbleOffset), "$" + chg, if isUp and chgHigh > 0 then Color.Green else if isUp and chgHigh < 0 then Color.Red else if isUp then Color.Yellow else if !isUp and chgLow > 0 then Color.Green else if !isUp and chgLow < 0 then Color.Red else Color.Yellow, isUp); # Price at Zigzag High/Low AddChartBubble(showBubblesPrice and !IsNaN(zz) and BarNumber() != 1, if isUp then high * (1 + BubbleOffset) else low * (1 - BubbleOffset), if isUp then "$" + high else "$" + low , if isUp and chgHigh > 0 then Color.Green else if isUp and chgHigh < 0 then Color.Red else if isUp then Color.Yellow else if !isUp and chgLow > 0 then Color.Green else if !isUp and chgLow < 0 then Color.Red else Color.Yellow, isUp); # Bar Count between Zigzags AddChartBubble(showBubblesBarCount and !IsNaN(zz) and BarNumber() != 1, if isUp then high * (1 + BubbleOffset) else low * (1 - BubbleOffset), if zzSave == high then zzCountHigh else zzCountLow, if isUp and chgHigh > 0 then Color.Green else if isUp and chgHigh < 0 then Color.Red else if isUp then Color.Yellow else if !isUp and chgLow > 0 then Color.Green else if !isUp and chgLow < 0 then Color.Red else Color.Yellow, if isUp then yes else no ); # Volume at Zigzag Reversals AddChartBubble(showBubblesVolume and !IsNaN(zz) and BarNumber() != 1, if isUp then high * (1 + bubbleoffset) else low * (1 - bubbleoffset), chgVol,if isUp and chghigh > 0 then Color.Green else if isUp and chghigh < 0 then Color.Red else if isUp then Color.Yellow else if !isUp and chglow > 0 then Color.Green else if !isUp and chglow < 0 then Color.Red else Color.Yellow, if isUp then yes else no ); # Arrows def zzL = if !IsNaN(zz) and !isUp then low else GetValue(zzL, 1); def zzH = if !IsNaN(zz) and isUp then high else GetValue(zzH, 1); def dir = CompoundValue(1, if zzL != zzL[1] or low == zzL[1] and low == zzSave then 1 else if zzH != zzH[1] or high == zzH[1] and high == zzSave then -1 else dir[1], 0); def signal = CompoundValue(1, if dir > 0 and low > zzL then if signal[1] <= 0 then 1 else signal[1] else if dir < 0 and high < zzH then if signal[1] >= 0 then -1 else signal[1] else signal[1], 0); plot U1 = showArrows and signal > 0 and signal[1] <= 0; U1.SetPaintingStrategy(PaintingStrategy.BOOLEAN_ARROW_UP); U1.SetDefaultColor(Color.Green); U1.SetLineWeight(4); plot D1 = showArrows and signal < 0 and signal[1] >= 0; D1.SetPaintingStrategy(PaintingStrategy.BOOLEAN_ARROW_DOWN); D1.SetDefaultColor(Color.Red); D1.SetLineWeight(4); # Alerts Alert(useAlerts and U1, "ZIG-UP", Alert.BAR, Sound.Bell); Alert(useAlerts and D1, "ZAG-DOWN", Alert.BAR, Sound.Chimes); # Supply Demand Areas def data1 = CompoundValue(1, if (zzSave == high or zzSave == low) then data1[1] + 1 else data1[1], 0); def dataCount1 = (HighestAll(data1) - data1[1]); def idx = showSupplyDemand == showSupplyDemand.Pivot; def rLow; def rHigh; if signal crosses 0 { rLow = low[idx]; rHigh = high[idx]; } else { rLow = rLow[1]; rHigh = rHigh[1]; } plot HighLine = if dataCount1 <= numberSuppDemandToShow and showSupplyDemand != showSupplyDemand.None and !isNaN(close) and rHigh != 0 then rHigh else Double.NaN; HighLine.SetPaintingStrategy(PaintingStrategy.HORIZONTAL); HighLine.AssignValueColor(if signal > 0 then Color.Green else Color.Red); plot LowLine = if dataCount1 <= numberSuppDemandToShow and showSupplyDemand != showSupplyDemand.None and !isNaN(close) and rLow != 0 then rLow else Double.NaN; LowLine.SetPaintingStrategy(PaintingStrategy.HORIZONTAL); LowLine.AssignValueColor(if signal > 0 then Color.Green else Color.Red); def hlUp = if signal > 0 then HighLine else Double.NaN; def hlDn = if signal < 0 then HighLine else Double.NaN; AddCloud(if showSupplyDemandCloud then hlUp else Double.NaN, LowLine, Color.Light_Green, Color.Light_Green); AddCloud(if showSupplyDemandCloud then hlDn else Double.NaN, LowLine, Color.Light_Red, Color.Light_Red); # End ZigZag High Low Supply Demand
jgarvais07
New member
I noticed not all pivots up/down are accompanied by arrows. When an arrow up/down does accompany a pivot change, it is usually legit. Would it be possible to create a watch list widget that alerts when an arrow alerts - possible labels UP arrow (buy) and Down arrow (Sell)? My brother made the following script but it is too complex with the following message (yellow warning symbol -"complex script, you may experience greater load times"). Is there any way to streamline this code to be less complex and work in a watchlist widget?SleepyZ, thank you so much! I l added it to my watchlist and it works perfectly!!!!
declare once_per_bar;
#TOS version ZigZagHighLow modified in part by Linus' and Lar's code
input bubbleoffset = .0005;
input percentamount = .01;
input revAmount = .15;
input atrreversal = 1.0;
input atrlength = 5;
def zz = ZigZagHighLow("price h" = high, "price l" = low, "percentage reversal" = percentAmount, "absolute reversal" = revAmount, "atr length" =atrlength, "atr reversal" = atrreversal);
def reversalAmount = if (close * percentamount / 100) > Max(revAmount < atrreversal * atrlength, revAmount) then (close * percentamount / 100) else if revAmount < atrreversal * atrlength then atrreversal * atrlength else revAmount;
rec zzSave = if !IsNaN(zz) then zz else GetValue(zzSave, 1);
def chg = (if zzSave == high then high else low) - GetValue(zzSave, 1);
def isUp = chg >= 0;
rec isConf = AbsValue(chg) >= reversalAmount or (IsNaN(GetValue(zz, 1)) and GetValue(isConf, 1));
def zzd = if isUp then 1 else 0;
def zzp = if zzd <= 1 then zz else Double.NaN;
#Arrows
def zzL = if !IsNaN(zz) and !isUp then low else GetValue(zzL, 1);
def zzH = if !IsNaN(zz) and isUp then high else GetValue(zzH, 1);
def dir = CompoundValue(1, if zzL != zzL[1] or low==zzl[1] and low==zzsave then 1 else if zzH != zzH[1] or high==zzh[1] and high==zzsave then -1 else dir[1], 0);
def signal = CompoundValue(1, if dir > 0 and low > zzL then if signal[1] <= 0 then 1 else signal[1] else if dir < 0 and high < zzH then if signal[1] >= 0 then -1 else signal[1] else signal[1], 0);
def U1 = signal > 0 and signal[1] <= 0;
def D1 = signal < 0 and signal[1] >= 0;
AddLabel(U1, "Buy", color.black);
AddLabel(D1, "Sell", color.black);
AddLabel(!U1 and !D1, "-", CreateColor(105, 105, 105));
AssignBackgroundColor(if U1 then CreateColor(63, 220, 84) else if D1 then CreateColor(178, 34, 34) else (color.black));
Last edited:
jgarvais07
New member
Hello everyone!
I am currently using the following thinkscript-
ZigZag High Low with Supply DemandIndex and Fibs_Linus_Lar
(Link -https://usethinkscript.com/threads/zigzag-high-low-with-supply-demand-zones-for-thinkorswim.172/)
There is a part of the code that I find extremely helpful (up and down arrow alerts) and would love to have a watchlist widget and scan that notifies me when these arrows trigger. My brother tried to make a scan and watchlist widget, but the code is is too complex with the following message (yellow warning symbol -"complex script, you may experience greater load times"). Is there any way to streamline this code to be less complex and work in a watchlist widget and scan?
SleepyZ made a stripped down portion of the code for a watchlist widget that works great (still complex - but doesn't freeze and works consistently). It identifies the number of pivot changes (and lists them green for up and red for down).
Example: A green 2 on a five minute chart means (two) candlesticks pivoted to the upside and are consecutively higher than the previous swing low.
(Link https://usethinkscript.com/threads/...upply-demand-zones-for-thinkorswim.172/page-4)
Unfortunately, not all pivots are accompanied by arrows, otherwise this would work for my needs.
When an arrow up/down DOES accompany a pivot change, it is usually legit.
Question: Would it be possible to create a non-complex watchlist widget and scan that alerts when an arrow alerts? I am attaching the (1) original code, (2) SleepyZ's watchlist code, (3) a scan for arrows my brother made that works but is too complex to work consistently enough to use.
I also am attaching a screenshot of the code in action (note the green arrows up on VERU 5 min, 4H, and Day charts and the ZZ watchlist column - SleepyZ's code).
Thank you for your time.
Attachments
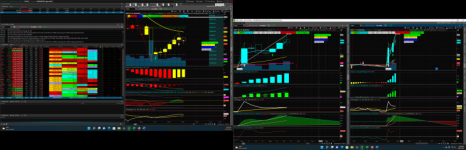
Last edited:
prmichaelsen2
New member
@RobertPayne hey mate, I'm trying to generate a buy signal on valleys. is that possible using this script?
https://usethinkscript.com/threads/...d-zones-for-thinkorswim.172/page-2#post-10748@RobertPayne hey mate, I'm trying to generate a buy signal on valleys. is that possible using this script?
GoldStriple
Member
I wanted a smaller cloud size on the S/D zones .. the code below will plot a MID line and use that for the UP and DOWN clouds. The extra line can be un-plotted if need be in settings. Replace this section in your zig zag studies.
Code:
#Supply Demand Areas
rec data1 = CompoundValue(1, if (zzSave == high or zzSave == low) then data1[1] + 1 else data1[1], 0);
def datacount1 = (HighestAll(data1) - data1[1]);
input numbersuppdemandtoshow = 2;
input showSupplyDemand = {default Pivot, Arrow, None};
def idx = if showSupplyDemand == showSupplyDemand.Pivot then 1 else 0;
def rLow;
def rMid;
def rHigh;
if signal crosses 0 {
    rLow = low[idx];
    rMid = (high[idx] + low[idx])/2;
    rHigh = high[idx];
} else {
    rLow = rLow[1];
    rMid = (rhigh[1] + rlow[1])/2;
    rHigh = rHigh[1];
}
plot HighLine = if datacount1 <= numbersuppdemandtoshow and showSupplyDemand != showSupplyDemand.None and !isNaN(close) and rHigh != 0 then rHigh else Double.NaN;
HighLine.SetPaintingStrategy(PaintingStrategy.HORIZONTAL);
HighLine.AssignValueColor(if signal > 0 then Color.GREEN else Color.RED);

plot MidLine = if datacount1 <= numbersuppdemandtoshow and  showSupplyDemand != showSupplyDemand.None and !isNaN(close) and rMid != 0 then rMid else Double.NaN;
MidLine.SetPaintingStrategy(PaintingStrategy.HORIZONTAL);
MidLine.AssignValueColor(if signal > 0 then Color.GREEN else Color.RED);

plot LowLine = if datacount1 <= numbersuppdemandtoshow and  showSupplyDemand != showSupplyDemand.None and !isNaN(close) and rLow != 0 then rLow else Double.NaN;
LowLine.SetPaintingStrategy(PaintingStrategy.HORIZONTAL);
LowLine.AssignValueColor(if signal > 0 then Color.GREEN else Color.RED);

def hlUp = if signal > 0 then MidLine else Double.NaN;
def hlDn = if signal < 0 then HighLine else Double.NaN;

input showsupplydemandcloud = yes;
AddCloud(if showsupplydemandcloud then hlUp else double.nan, LowLine, Color.LIGHT_GREEN, Color.LIGHT_GREEN);
AddCloud(if showsupplydemandcloud then hlDn else double.nan, MidLine, Color.LIGHT_RED, Color.LIGHT_RED);Hey @SleepyZ , I really love the ZigZag study you updated with the Fibonacci Extensions -- it's quickly become one of my favorite studies to help with zones. One request I have though, and I apologize if this has already been done or isn't possible, but is it possible to be able to extend these zones further out until they're invalidated? I noticed this today, and while the zones still helped a lot I realized the cloud didn't extend until the next swing completed:


Is this just a property of the zigzag, or can I extend those clouds fully right away? I noticed there seemed to be similar code on the first page of this but I couldn't tell if it translated to this study or not.
Is this just a property of the zigzag, or can I extend those clouds fully right away? I noticed there seemed to be similar code on the first page of this but I couldn't tell if it translated to this study or not.
@nrk786 @jgarvais07 @iFrostyy
Repainting studies such as those scripts in this thread cannot be use in scans, watchlists or conditional orders.
The scripts are too complex
Read more:
https://usethinkscript.com/threads/answers-to-commonly-asked-questions.6006/#post-57834
Repainting studies such as those scripts in this thread cannot be use in scans, watchlists or conditional orders.
The scripts are too complex
Read more:
https://usethinkscript.com/threads/answers-to-commonly-asked-questions.6006/#post-57834
Last edited:
Join useThinkScript to post your question to a community of 21,000+ developers and traders.
Similar threads
-
-
 Momentum-based-ZigZag-incl-QQE-NON-REPAINTING for ThinkOrSwim
- Started by samer800
- Replies: 7
-
 Repaints Harmonic Patterns Indicator for ThinkorSwim (ZigZag, Bat, Butterfly, ABCD)
- Started by BenTen
- Replies: 142
-
 Previous Day High/Low/Close + Premarket High/Low + High/Low/Open of Day + ATR Lines for ThinkorSwim
- Started by Wiinii
- Replies: 107
-
Not the exact question you're looking for?
Start a new thread and receive assistance from our community.
87k+
Posts
1680
Online
Similar threads
-
-
Momentum-based-ZigZag-incl-QQE-NON-REPAINTING for ThinkOrSwim
- Started by samer800
- Replies: 7
-
Repaints Harmonic Patterns Indicator for ThinkorSwim (ZigZag, Bat, Butterfly, ABCD)
- Started by BenTen
- Replies: 142
-
Previous Day High/Low/Close + Premarket High/Low + High/Low/Open of Day + ATR Lines for ThinkorSwim
- Started by Wiinii
- Replies: 107
-
The Market Trading Game Changer
Join 2,500+ subscribers inside the useThinkScript VIP Membership Club
- Exclusive indicators
- Proven strategies & setups
- Private Discord community
- ‘Buy The Dip’ signal alerts
- Exclusive members-only content
- Add-ons and resources
- 1 full year of unlimited support
Frequently Asked Questions
What is useThinkScript?
useThinkScript is the #1 community of stock market investors using indicators and other tools to power their trading strategies. Traders of all skill levels use our forums to learn about scripting and indicators, help each other, and discover new ways to gain an edge in the markets.
How do I get started?
We get it. Our forum can be intimidating, if not overwhelming. With thousands of topics, tens of thousands of posts, our community has created an incredibly deep knowledge base for stock traders. No one can ever exhaust every resource provided on our site.
If you are new, or just looking for guidance, here are some helpful links to get you started.
- The most viewed thread:
https://usethinkscript.com/threads/repainting-trend-reversal-for-thinkorswim.183/ - Our most popular indicator:
https://usethinkscript.com/threads/buy-the-dip-indicator-for-thinkorswim.3553/ - Answers to frequently asked questions:
https://usethinkscript.com/threads/answers-to-commonly-asked-questions.6006/
What are the benefits of VIP Membership?
VIP members get exclusive access to these proven and tested premium indicators: Buy the Dip, Advanced Market Moves 2.0, Take Profit, and Volatility Trading Range. In addition, VIP members get access to over 50 VIP-only custom indicators, add-ons, and strategies, private VIP-only forums, private Discord channel to discuss trades and strategies in real-time, customer support, trade alerts, and much more. Learn all about VIP membership here.
How can I access the premium indicators?
To access the premium indicators, which are plug and play ready, sign up for VIP membership here.