Volume is the second most important trading indicator, according to CustomizedTrading. Here is a quick snippet of their introductory to the indicator.
Robert from Researchtrade was able to convert the Time Based Volume indicator over to ThinkorSwim. Here is the full script.
Notes:

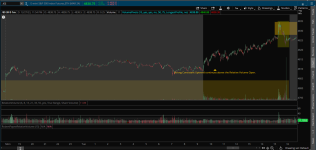
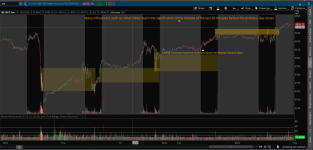
Time Based Volume completely eliminates the high volume distortion that occurs after the open of a market, just before the close of a market, and the low volume that occurs at market lunch times. Since the Time Based Volume Indicator is time based it will work on any intraday time based chart and symbol (including Forex).
Robert from Researchtrade was able to convert the Time Based Volume indicator over to ThinkorSwim. Here is the full script.
Notes:
- Cyan = Bullish
- Darker blue = Bullish smaller
- Magenta = Bearish
- Darker purple = Bearish smaller
thinkScript Code
Rich (BB code):
# Time Based Volume
# Robert Payne
declare lower;
input LookBack = 20;
def nMinutes = GetAggregationPeriod() / 60000;
def nBars = RoundUp(390 / nMinutes, 0);

def pvSum = fold idx = 1 to LookBack + 1 with a=0 do a + GetValue(volume, idx * nBars, LookBack * nBars);

def pvAvg = pvSum / LookBack;
def VolPct = (volume / pvAvg) * 100;

plot avgLine = 100;
avgLine.SetDefaultColor(Color.GRAY);
avgLine.SetStyle(Curve.LONG_DASH);

def lastUp = if IsNaN(lastUp[1]) then 0 else if (close > open) then VolPct else lastUp[1];
def lastDn = if IsNaN(lastDn[1]) then 0 else if (close < open) then VolPct else lastDn[1];

plot Vol = VolPct;
Vol.SetPaintingStrategy(PaintingStrategy.HISTOGRAM);
Vol.DefineColor("Bullish", Color.CYAN);
Vol.DefineColor("Bullish Smaller", CreateColor(0, 128, 128));
Vol.DefineColor("Bearish", Color.MAGENTA);
Vol.DefineColor("Bearish Smaller", CreateColor(128, 0, 128));
Vol.AssignValueColor(if (close > open) and (VolPct > lastUp[1]) then Vol.Color("bullish" ) else if close > open then Vol.Color("bullish smaller" ) else if close < open and VolPct > lastDn[1] then Vol.Color("bearish" ) else Vol.Color("bearish smaller" ));
Vol.SetLineWeight(3);
Shareable Link
https://tos.mx/nxOBq1Attachments
Last edited:
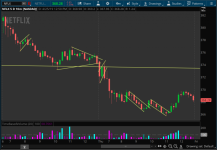
") Given the importance of the relationship between Price and Volume, here is time based Volume and Price linked together by color:
Given the importance of the relationship between Price and Volume, here is time based Volume and Price linked together by color: